Wormhole Culverts Part 4
Results of 1D and 2D sensitivity analyses for wormhole culverts
- Wormhole Culverts Part 1: Introducing the wormhole concept
- Wormhole Culverts Part 2: Using wormhole culverts for internal boundary conditions
- Wormhole Culverts Part 3: Comparing wormhole culverts to 1D/2D bridges and culverts
- Wormhole Culverts Part 4: Sensitivity analyses for wormhole culverts
- Wormhole Culverts Part 5: What’s the best shape for a wormhole culvert?
May 2018 update
[PLEASE NOTE: Wormhole culverts have become obsolete with the release of HEC-RAS Version 5.0.4. See our new article on what’s new in 5.0.4 for instructions and videos on using the new culvert options.]
“Good morning Worm, your honour…”
In our previous articles, we introduced the concept of wormhole culverts (Part 1), applied the technique to introduce internal boundary conditions (Part 2), and summarised the setup and results of a model comparing wormhole culverts to other methods (Part 3). This article presents “The Trial” in more detail along with a summary of sensitivity analysis results.
The goal of this exercise is to compare different 1D and 2D modelling approaches for a bridge over a channel – and to evaluate the viability of wormhole culverts as an alternative modeling approach in particular. To keep this write-up from blowing up even further, the results comparisons are limited to the water surface elevation profiles (acknowledging that velocity, shear, and other parameters may also be worth checking…maybe in a future post).
[As a matter of terminology, when I refer to 1D culverts, they are 1D structures that have been entered into a 1D model reach; when I refer to 2D culverts, they are 1D structures that have been entered into a 2D model reach (all structures in HEC-RAS are essentially 1D elements; in other words, flow through a culvert will be in a single direction only – we don’t put 2D grid elements inside a pipe!). Likewise, our geotif results will not include separate water surface elevations for the flow over a roadway and the flow inside a culvert at a given location along the culvert centreline.]
1-dimensional model
To keep things simple, I’ve used a uniform, straight, trapezoidal channel with a single roadway crossing for this example. For the channel itself, I’ve arbitrarily picked a 14-metre bottom width with 2H:1V side slopes and a roughness coefficient of 0.05. I’ve assigned a longitudinal slope of 1% over a reach length of 500 metres. I’ll start with a simple 1D model of the channel in HEC-RAS. Here is a typical cross section with results shown for three flow rates ranging from 40 m3/s to 140 m3/s:
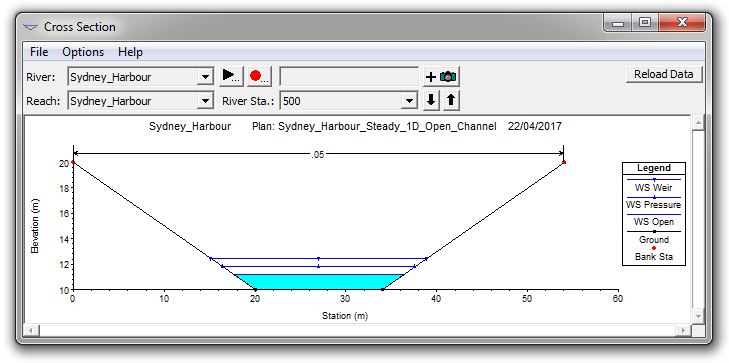
And here is the channel profile showing water surface elevations for the three flow rates:
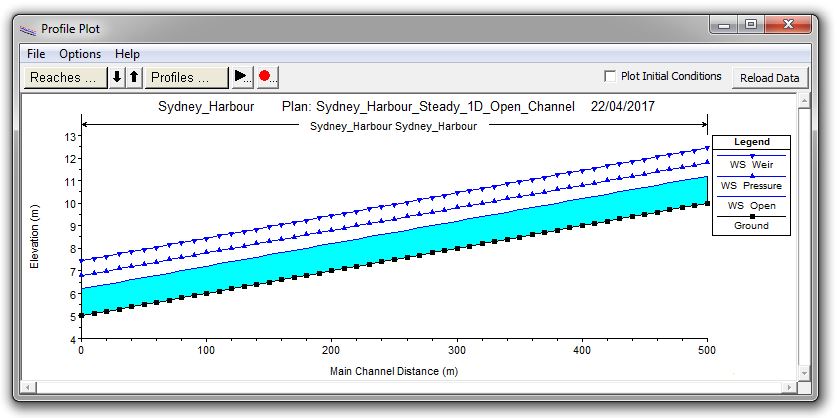
Here are the tabulated depth and velocity results:
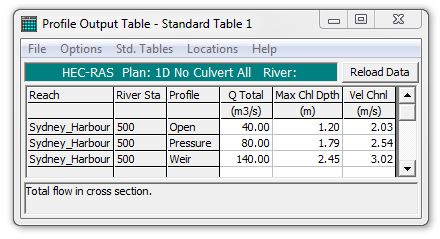
To demonstrate that HEC-RAS is simply solving Mannings Equation for a uniform, straight channel, we can enter the input variables into an online calculator and see that the depths match to within 1 cm, and velocities match to the hundredth of a metre per second.
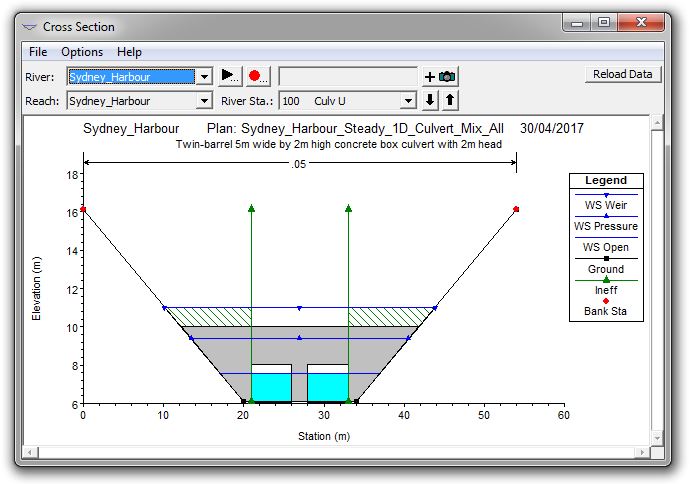
For the bridge itself, I used a 12-metre span with vertical abutments and a single, continuous 2-metre wide pier at the centre. I used a 2-metre height for the opening and a 2-metre high headwall (with a top elevation flush with the flat roadway deck elevation). I then copied the geometry to a new file with the structure modelled as a culvert using the same effective dimensions as the openings between the pier and abutments in the bridge model (I used twin-barrel 5-metre span by 2-metre rise concrete box culverts). Here is the cross section:
And here are the water surface elevation profiles with and without the structure in place:
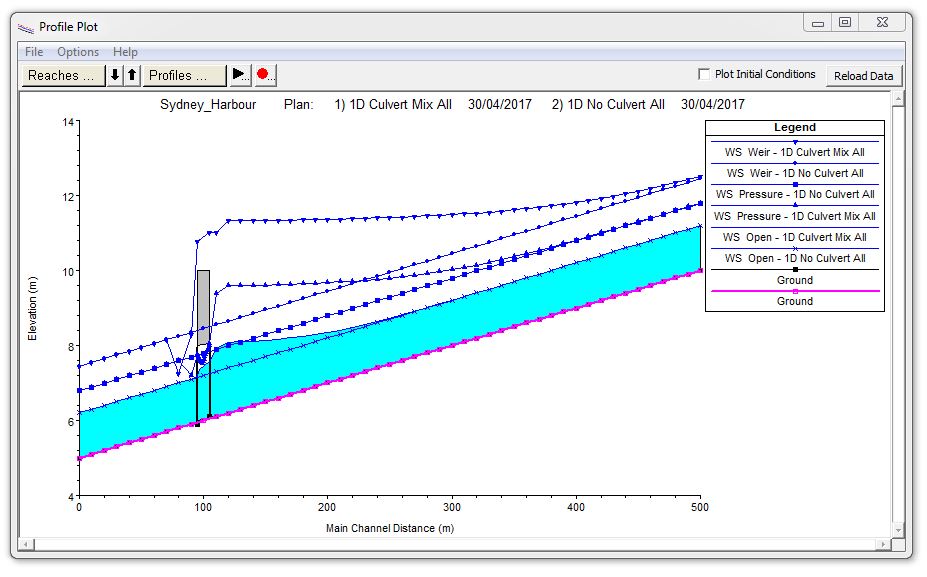
The water surface and energy profiles converge at the upstream extent of the model, demonstrating that we have extended the model a sufficient distance upstream to cover the backwater effect and reach the normal depth slope. The profiles also confirm that the three selected flow rates (40 m3/s, 80 m3/s, and 140 m3/s) result in the three situations that I want to compare: open channel flow, pressure flow, and overtopping/weir flow.
Here are the results comparing the three water surface profiles with the structure modelled as a bridge vs. culvert.
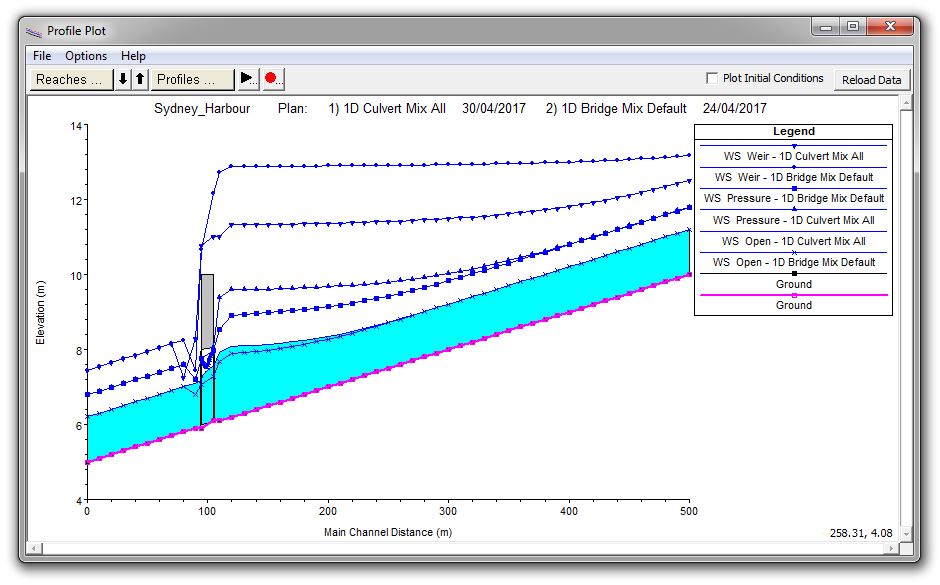
Although the dimensions of the opening and roadway deck are identical, the profiles above show that the results are quite different. Up to this point I’ve used default coefficients and modelling approaches for both structures. I can go into the Bridge Editor and simply change the high flow method from the default “Energy Only” method to “Pressure and/or Weir” as shown here:
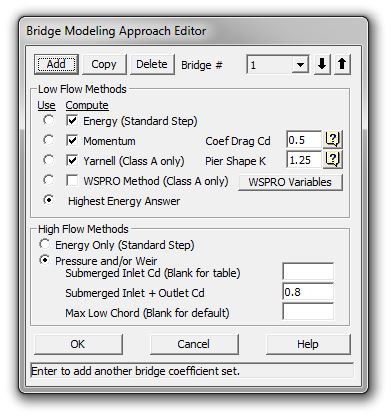
With that change, the bridge and culvert results end up being very similar to each other:
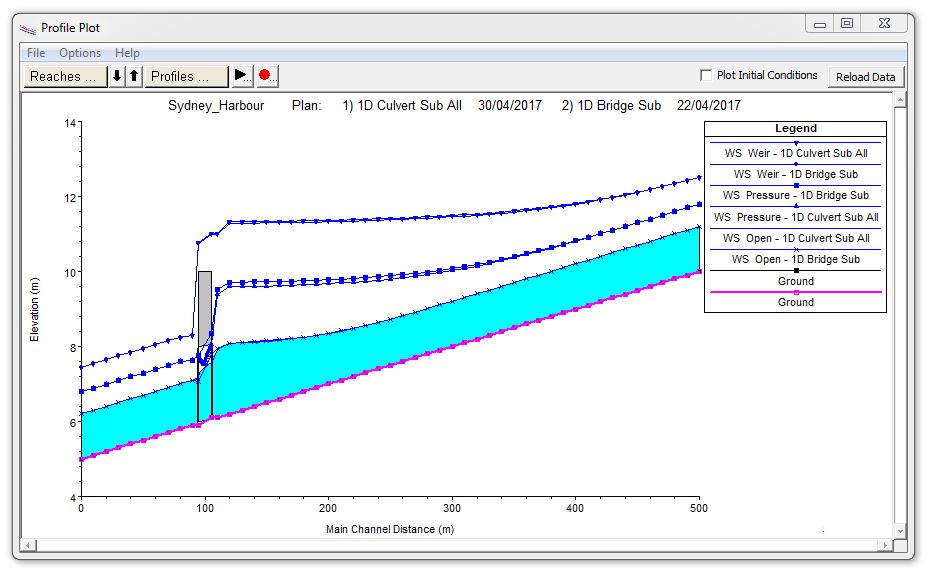
[Currently internal structures in HEC-RAS 2D can include culverts but not bridges, so I won’t be able to enter bridge parameters in my 2D model; given the similarity of the results above, though, I can comfortably go ahead and use the culvert configuration from the 1D model in the 2D model setup, and the 2D results can then be compared to both the 1D bridge and to the 1D culvert approach.]
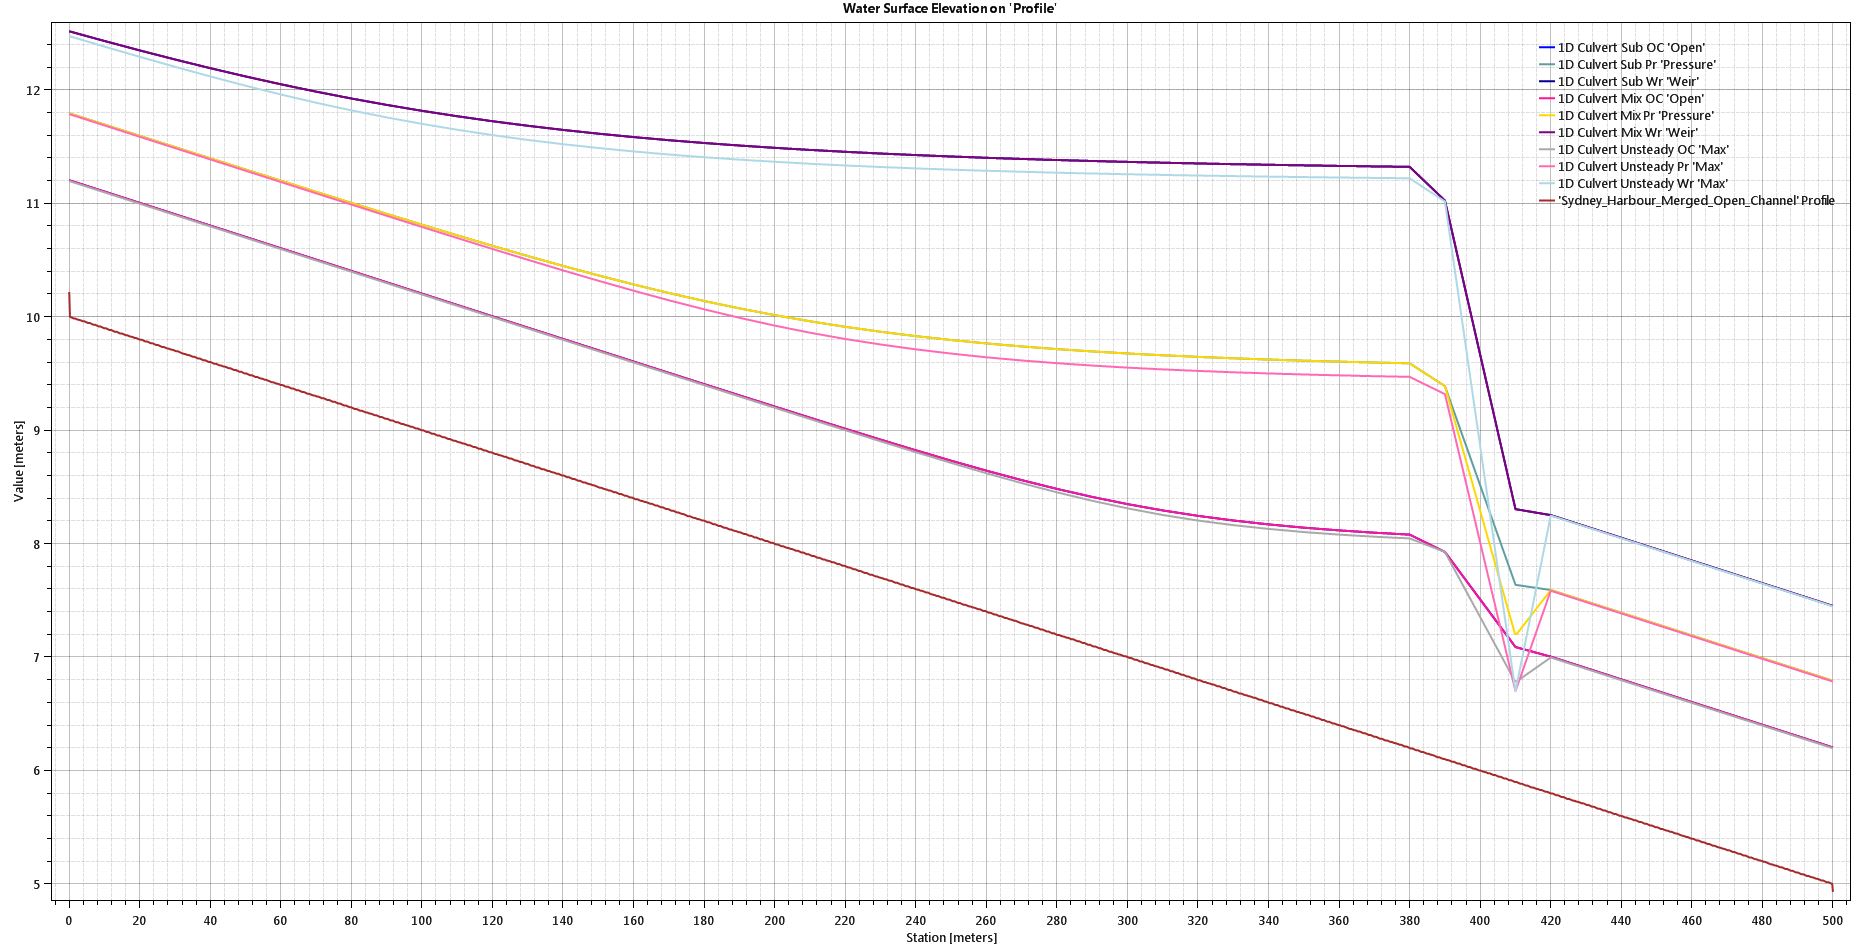
Another difference in water surface elevations appears if you change the flow regime. Here are the differences between the subcritical and mixed flow regime runs with the structure modelled as a culvert:
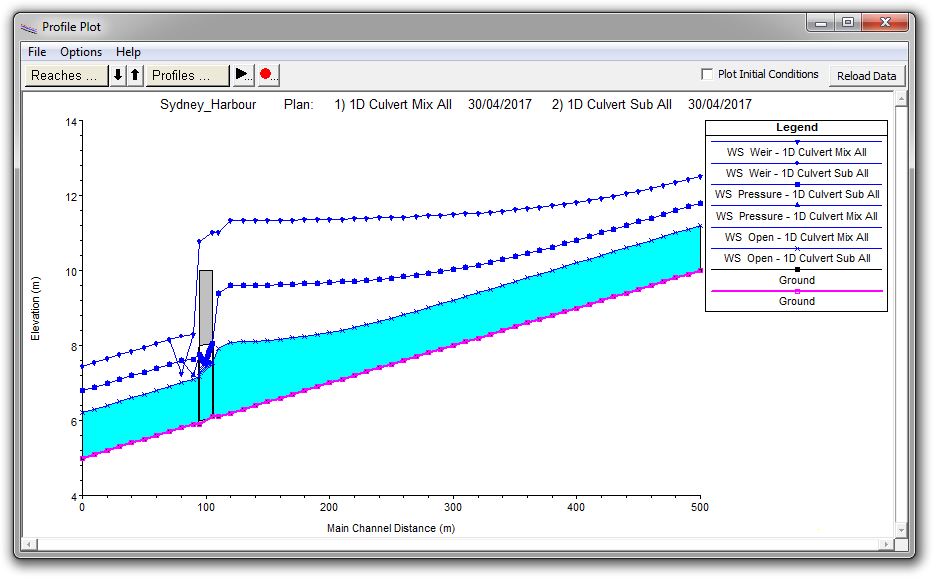
Note that the effect of the change on the water surface profile is limited to the two cross sections downstream of the structure.
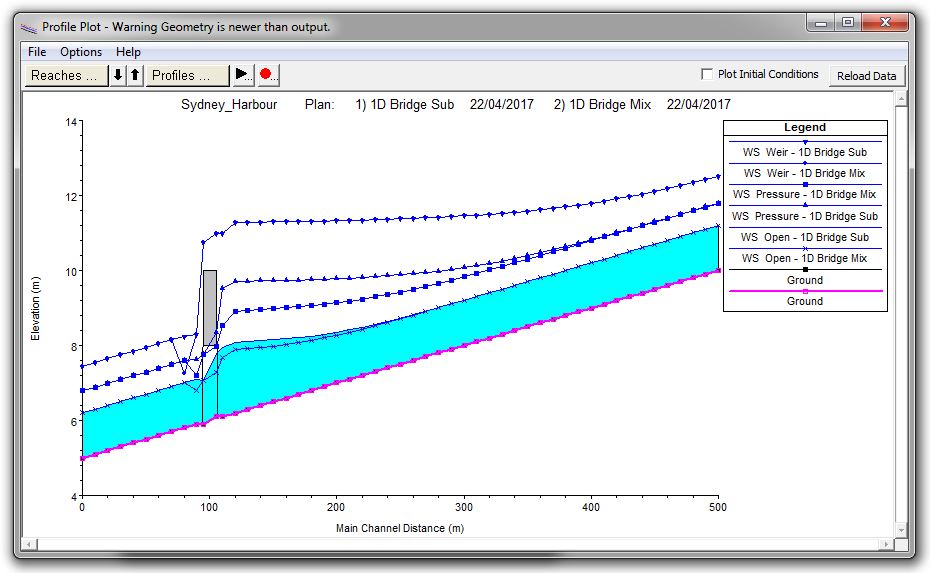
Here is the same comparison for the structure modelled as a bridge, showing that for this case the hydraulic effect of the structure can carry upstream several hundred metres:
The results above are for steady-state flows; while 1D models can use either steady or unsteady flows, 2D models require unsteady flow boundary conditions, so I’ll need to add a time axis to my flows in order to move into 2D. To keep the comparisons simple, I want to apply a constant flow rate, so I created an unsteady flow hydrograph in which the flows ramp up quickly and then stay at a constant peak flow rate long enough to allow conditions to stabilise along the profile. Essentially I’ve created a steady-state unsteady flow file.
For the remaining profile comparisons, I’ll switch to the profile viewer in RAS Mapper (switching our orientation as well) so that I can compare 2D results for multiple plans. [The RAS Mapper results are harder to see at this scale, but you can click on each image to enlarge or download the pdf file with each of the profile figures if you’d like to zoom in on any of the results.]
Here are the resulting water surface elevation profiles for steady vs. unsteady flow in 1D:
I then set up the unsteady flow analysis runs with the “Mixed Flow Regime” toggled off and on (using default coefficients). You would expect the steady vs. unsteady profiles to be the same, since they all use the same geometry and flow rates in the 1D processor; the results do show fairly close agreement between the profiles – but there are definitely some noticeable differences. Note that the effect of using mixed flows in 1D steady flow runs is quite different than the effect of using mixed flows in a 1D unsteady run. Read more on that topic on the HEC-RAS blog: Article 1 and Article 2.
2-dimensional model
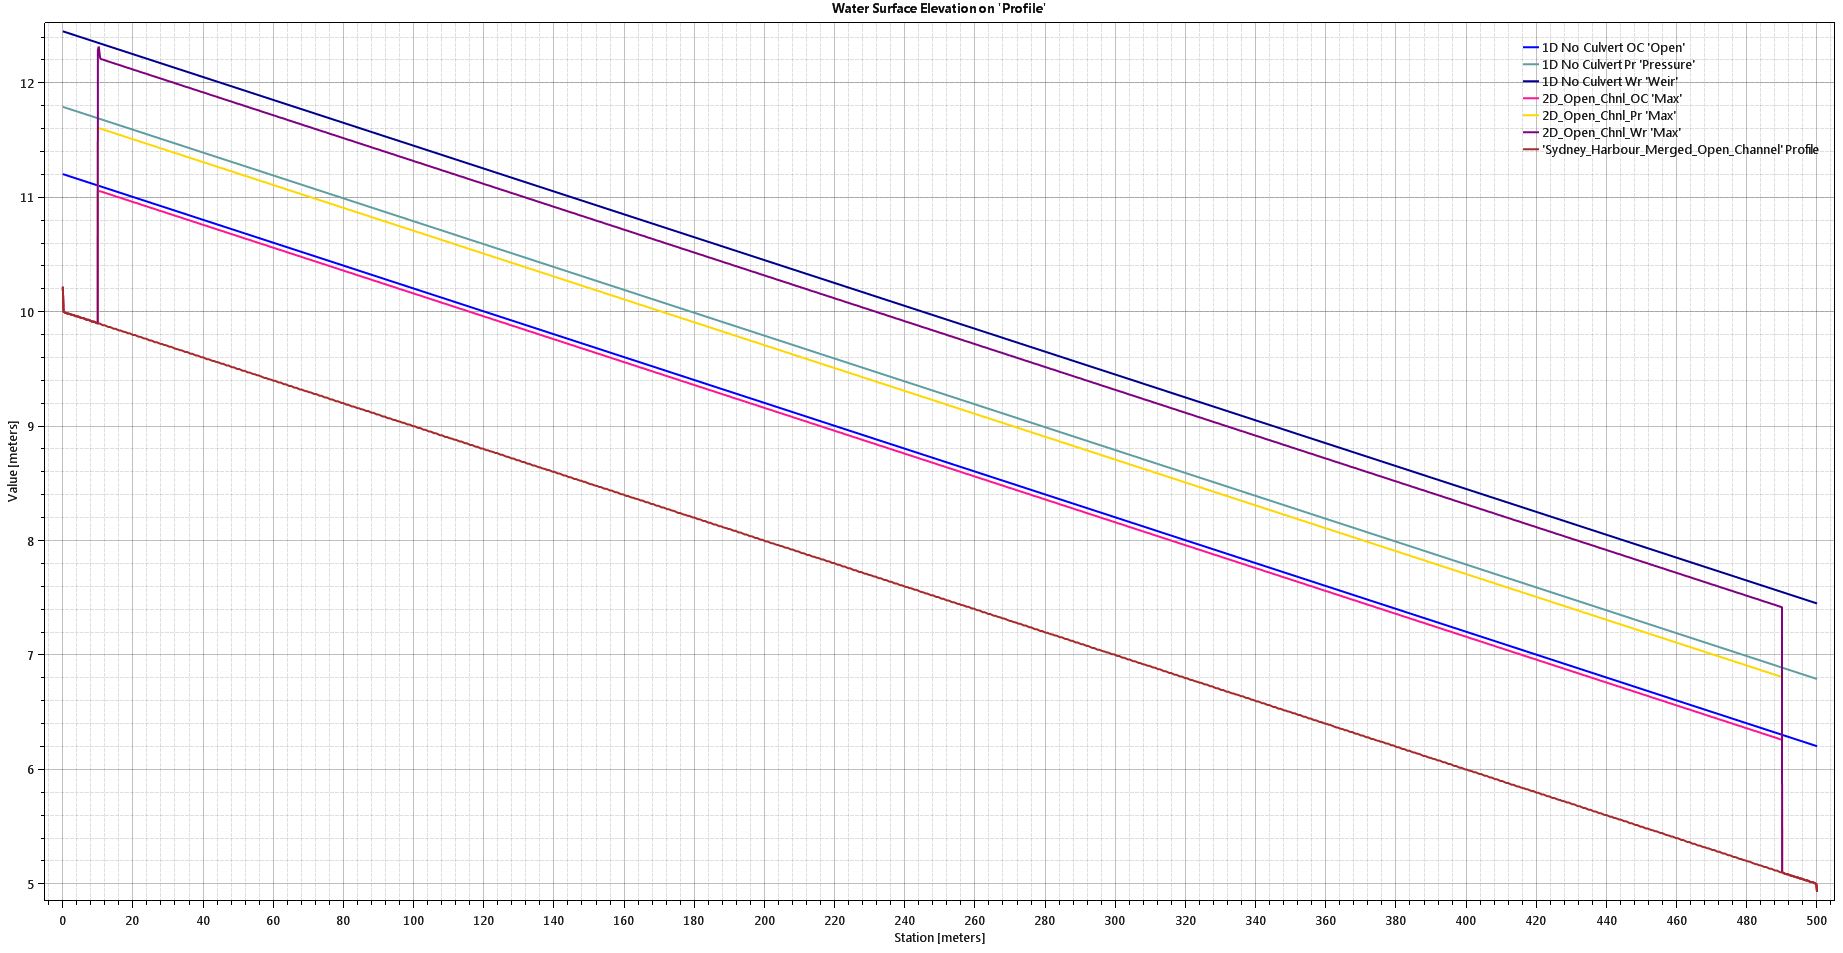
Moving into 2D, I first ran the open channel with no structure in place in order to compare to the 1D results. The 1D water surface elevations (which as we saw above are essentially identical to the Mannings equation results) end up being slightly higher than the 2D profile. The differences are more pronounced for higher flows as you can see below:
The results shown above are for a 0.5-metre computational mesh over a 0.5-metre resolution DEM terrain surface. There have been extensive discussions amongst hydraulic modellers concerning 1D vs 2D results (in particular, whether 1D and 2D models with the same geometry should use different roughness coefficients). I’m no expert on the subject, but I can understand how representing a smooth, sloping bank as a series of flat-bottomed grid elements in a DEM can affect the parameters that are applied in the 2D computations relative to the wetted perimeter and hydraulic radius as applied in Mannings equation; a number of publications have addressed this topic for more complicated situations, but I’d be curious to hear any thoughts on the subject related to this simplified example.
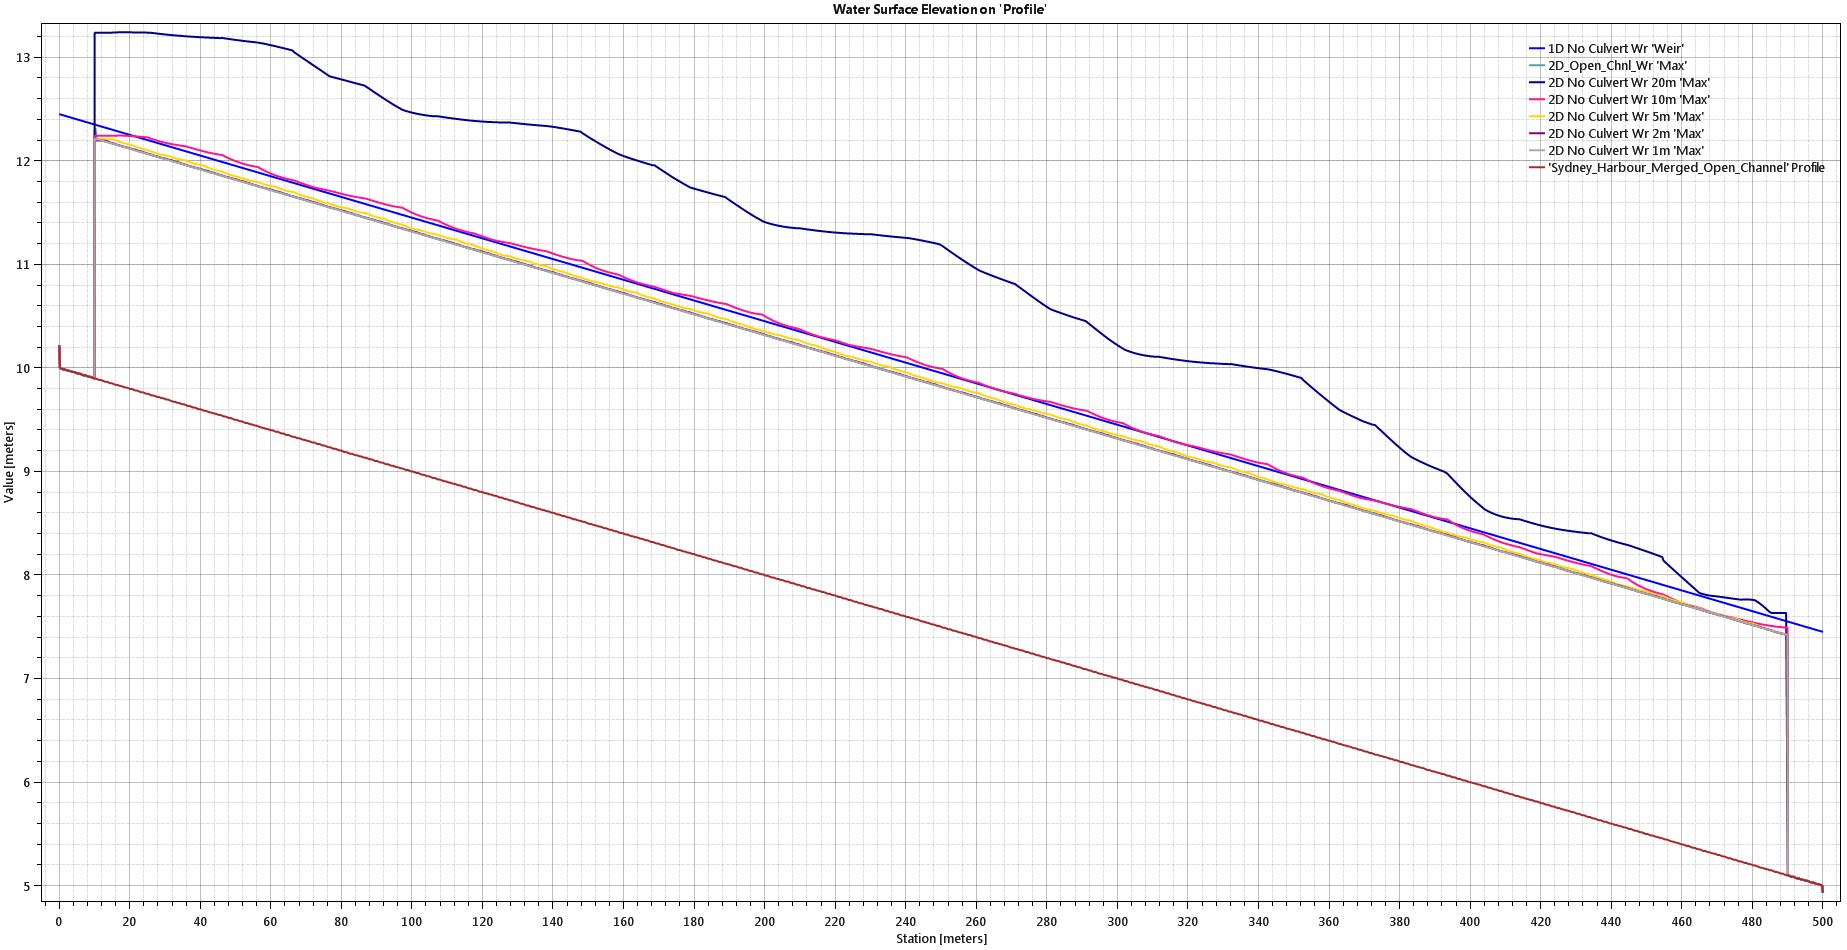
In order to check the effect of the grid size on the water surface elevations (and optimise computational time for the remaining runs), I ran a series of larger grid sizes as a sensitivity analysis. The 0.5-metre DEM was used for each of the runs, and no break lines were introduced. All runs use a 0.1-second time step. Here are the flow profiles for 2D grid sizes of 0.5 m, 1 m, 2 m, 5 m, 10 m, and 20 m compared to the 1D results for the 140 m3/s flow rate:
The 1-metre and 2-metre mesh size results are nearly identical to the 0.5-metre mesh, showing the convergence that we would expect to see; the results begin to diverge for larger grid sizes. The results would have been a bit different if I had incorporated break lines along the toe of bank (or if I had set up the model with a straight north-south alignment). The 20-metre computational mesh results are obviously incorrect, and there are some unrealistic oscillations in the other profiles as well that are related to the coarse grid sizes. Considering that the channel is only 14 metres wide, a 10-metre grid would seem far too coarse for this purpose, but it is interesting to note that the 10-metre grid (which includes some oscillations) matches the 1D results most closely.
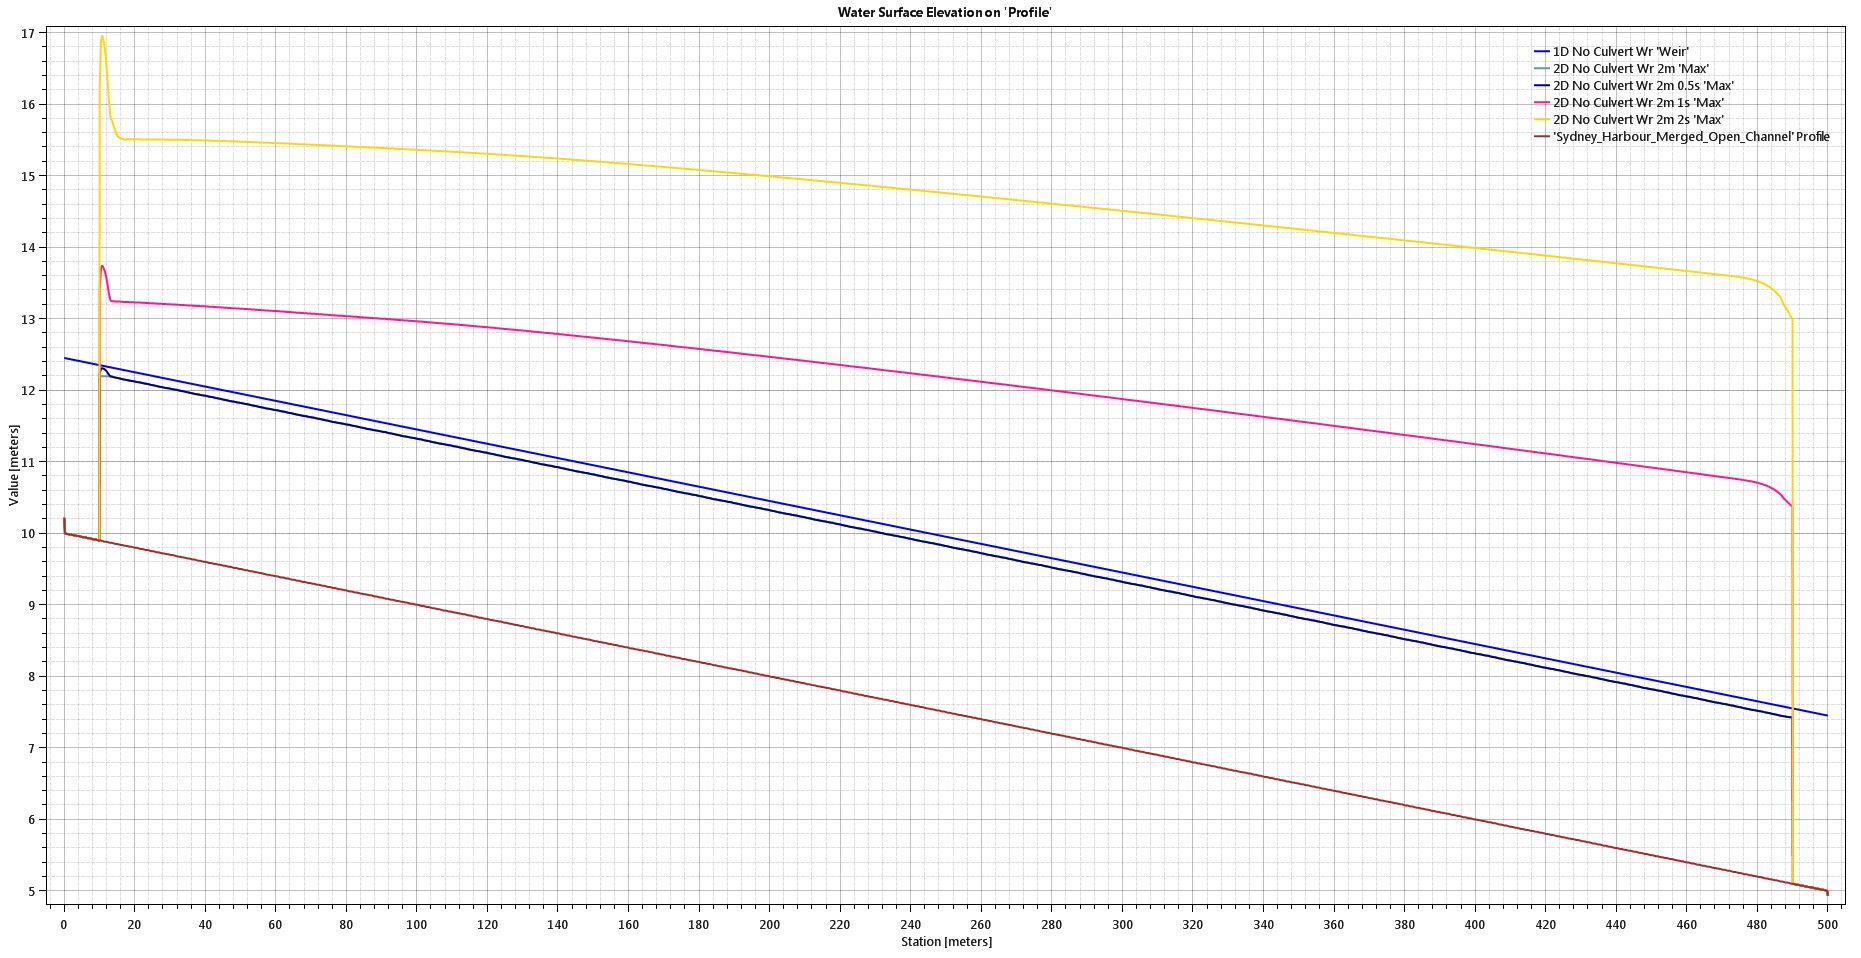
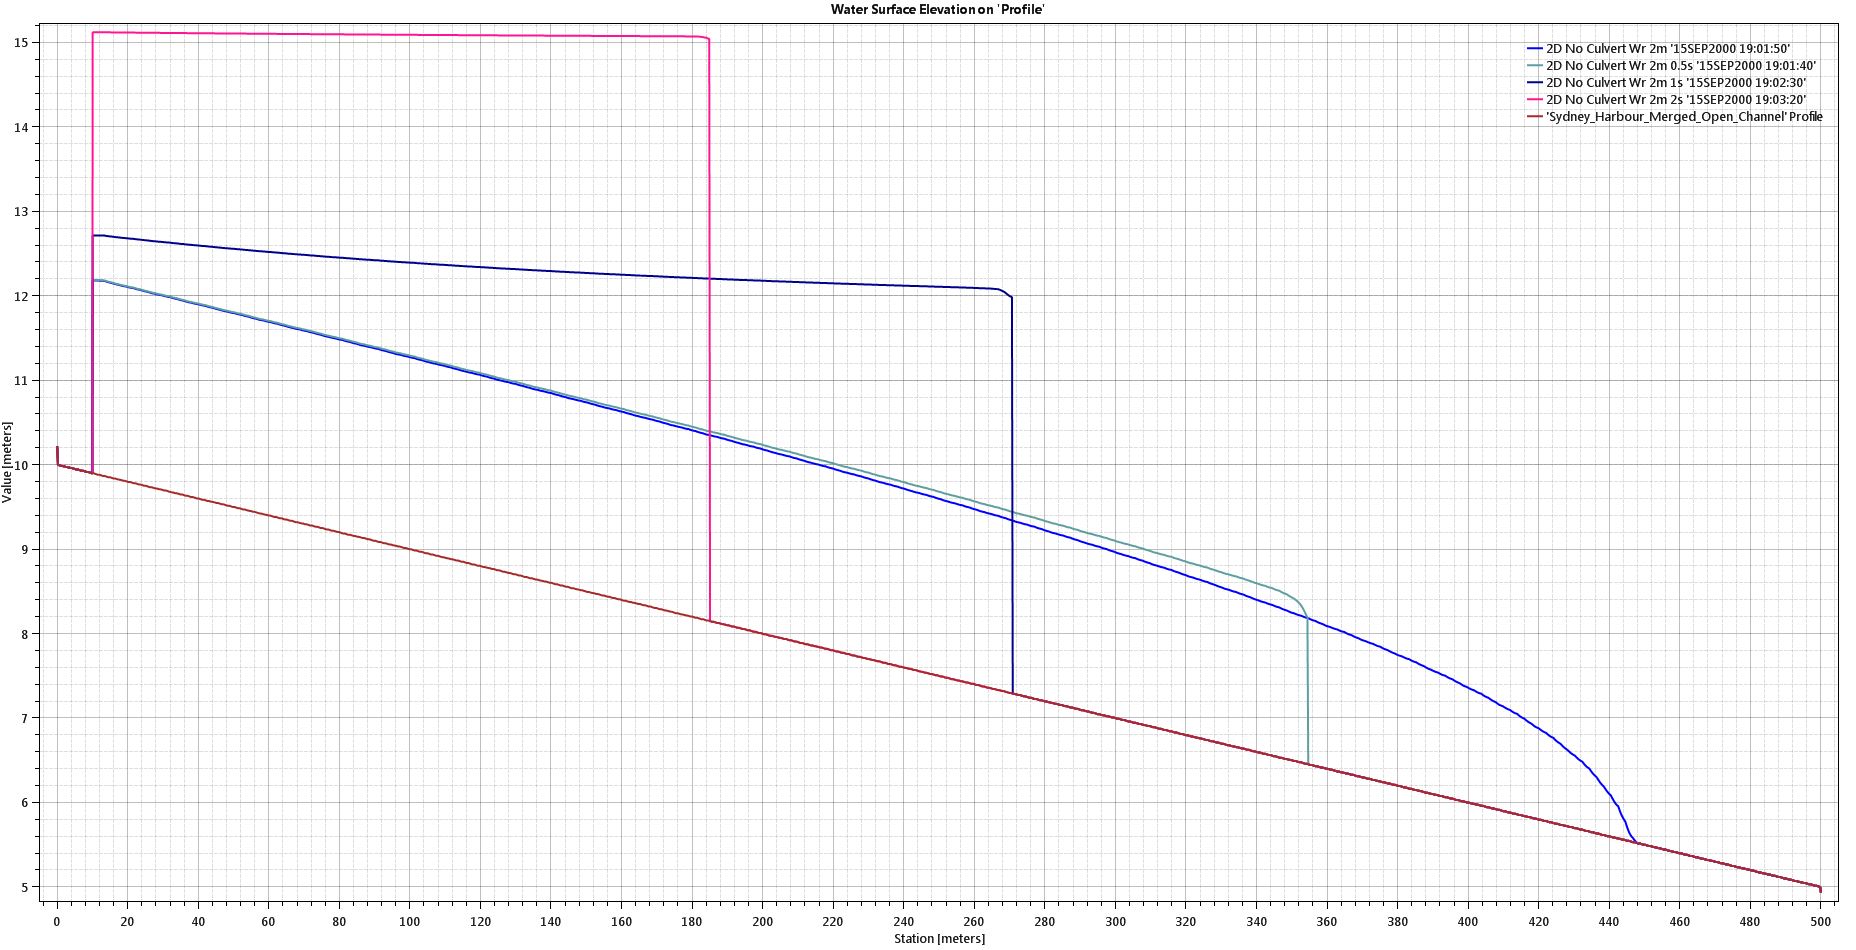
I also ran a series of time steps, including 0.1 s, 0.5 s, 1 s, and 2 s using the 2-metre resolution grid. Here are the resulting water surface elevation profiles:
The 0.1-second and 0.5-second time step results are nearly identical at the maximum condition shown; however, when we animate the plot and watch the flood wave propagate downstream, some issues become apparent with the 0.5-second run and the larger time steps as well:
This profile shows the classic vertical wetting front that occurs when maximum velocities (with wave celerity added) cause Courant Number violations, yielding completely unrealistic results. Essentially a number of grids get skipped between computations and the calculations can’t keep up with the flood wave. Another tell-tale sign in the plan view (which is often only apparent during the flood wave arrival and not from the maximum inundation extents) is that the inundation extents may show a straight line from bank to bank without the flow pushing forward into the deepest part of the channel. You can still get beautiful plan view animations out of HEC-RAS for runs that have significant stability issues; the cumulative mass balance errors can still end up being very small, and what by all appearances looks to be a completely stable run can generate meaningless hydraulic results that only become apparent when you look at the profile animations. [This is why in our 2D modelling courses we devote an entire workshop session toward the Courant number, selection of grid sizes and time steps, and scrutinising the results to uncover these issues.]
As shown in the profile above, reducing the time step yields a smoothly shaped wetting front as the flood wave moves downstream; the results converge around the 0.1-second time step, which was adopted as the time step for all subsequent model runs. The 0.5-metre resolution computational mesh was applied in the remaining runs, in order to match the underlying terrain resolution and avoid the need for break lines.
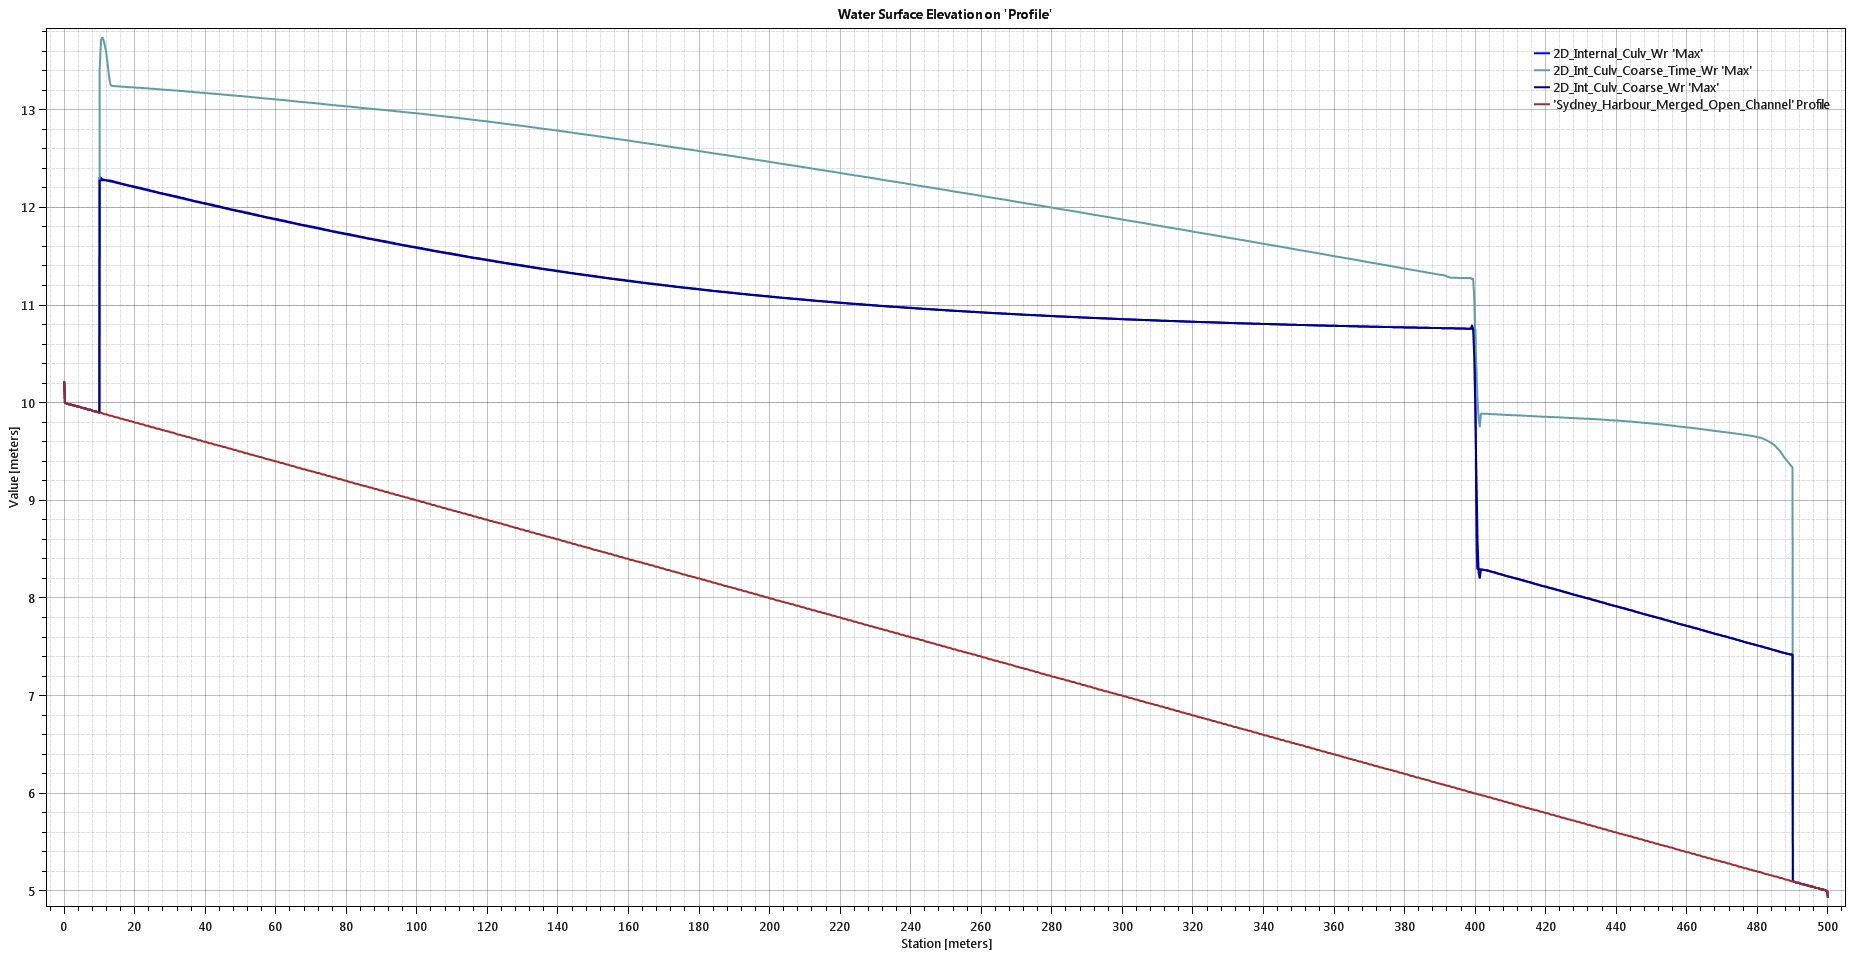
The sensitivity to grid size and computational time step varies when the structure is introduced. As shown in the profile below, the 0.5-metre and 2-metre grid size results are nearly identical when the 0.1-second time step is used. Raising the time step to 1 second yields unreasonable water surface elevations:
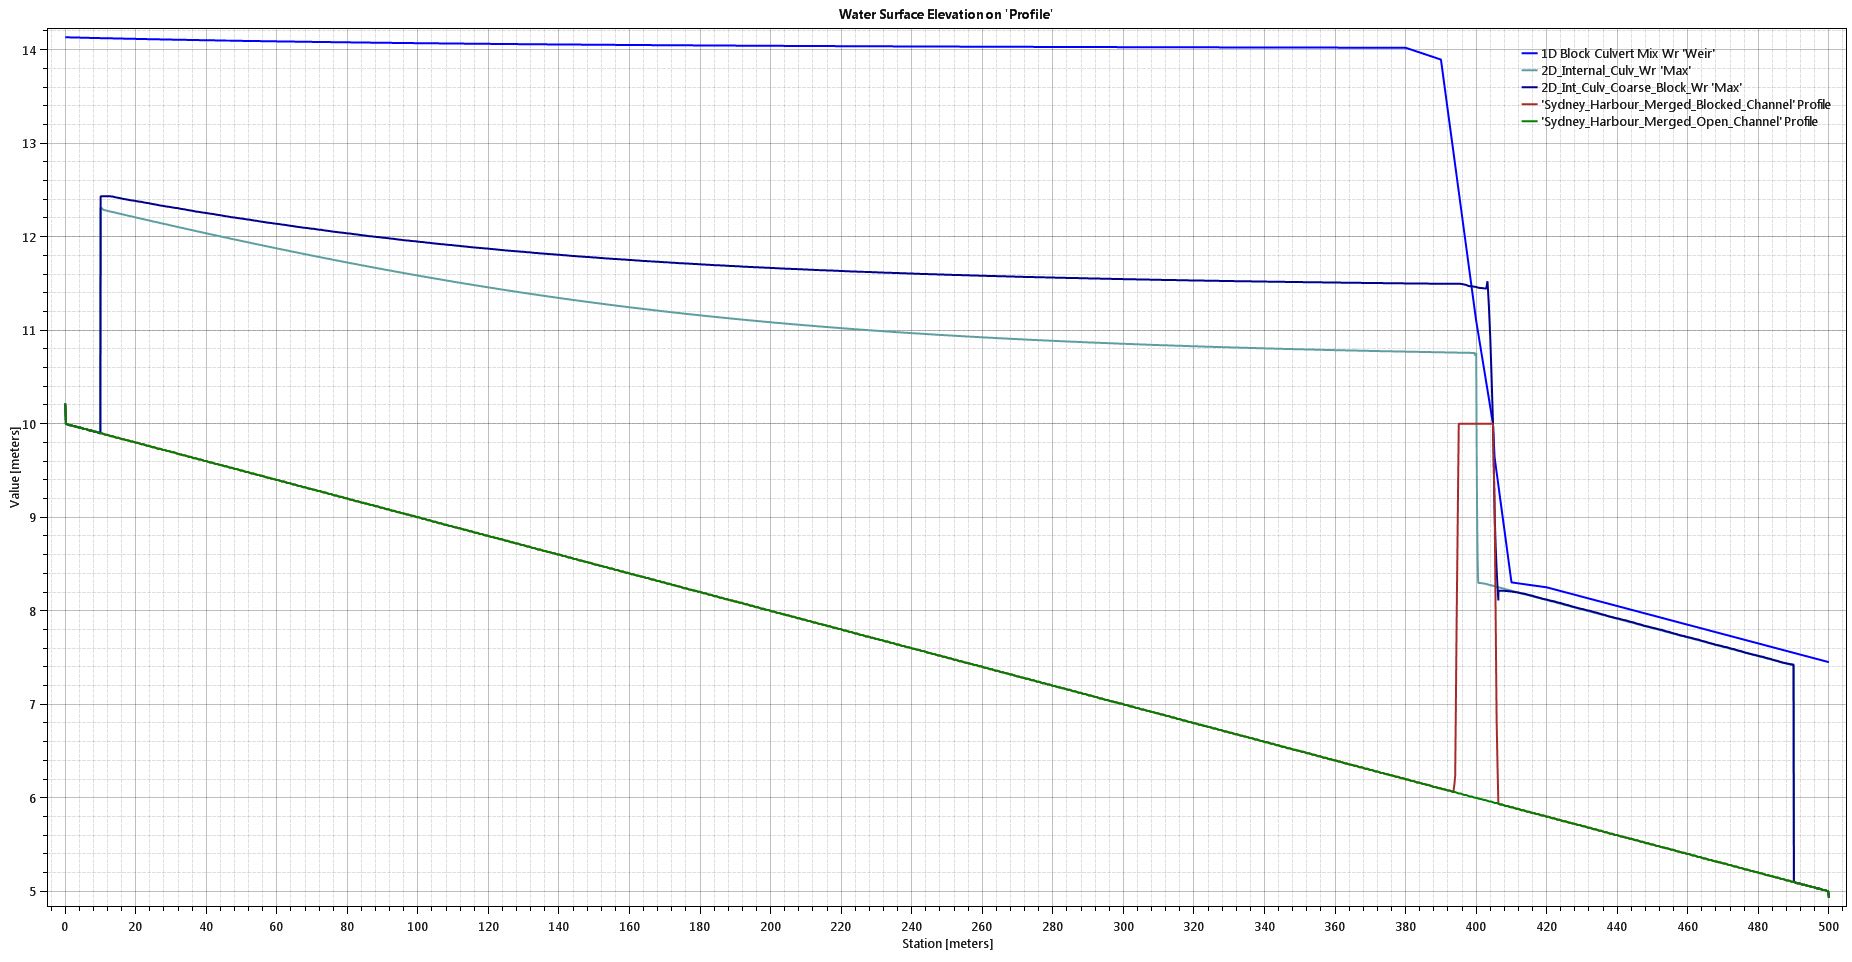
Another striking difference occurs when I compare completely blocked culverts, where all overtopping flow goes over the roadway deck and there is no flow through the culverts. When I completely roughen up or shrink down the culverts in the 1D model (without removing them entirely) the results go crazy; whereas in 2D, modelling the bridge deck as terrain only gives much more reasonable results. This profile shows the water surface profile results for the open culverts (lowest line) against the blocked culverts in the 2D model (middle line) and in the 1D model (highest line).
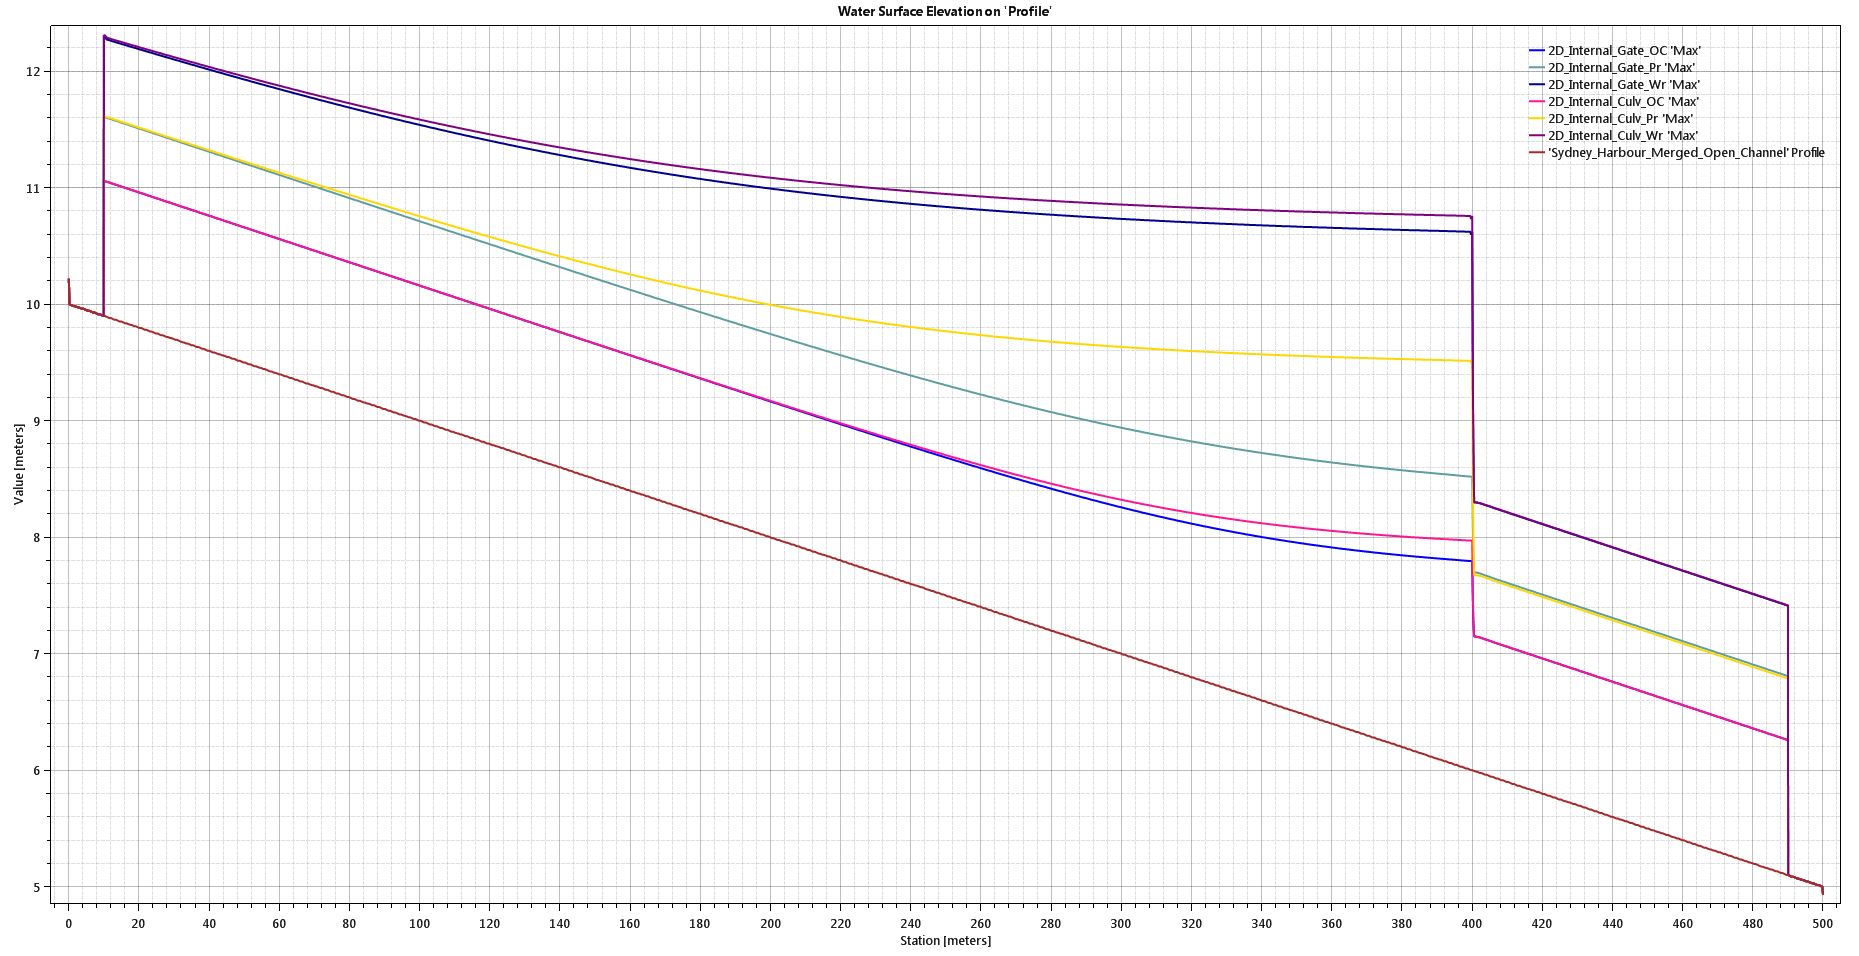
One of the options suggested in this article on the HEC-RAS blog is to model the bridge as a culvert with gates that represent the effective conveyance opening between the piers. Here are the results for a culvert vs. gates:
The agreement is fairly close for open channel flow and weir flow, but markedly difference for pressure flow.
The equation set also makes a significant difference in the results. For the uniform portions of the channel, the diffusion wave simplification is adequate; however, the full momentum equation provides more accurate results in the immediate vicinity of the culvert. Here is the summary comparison of the diffusion wave vs. the full momentum profiles, with the structure modelled as a standard internal SA/2D Area Connection:
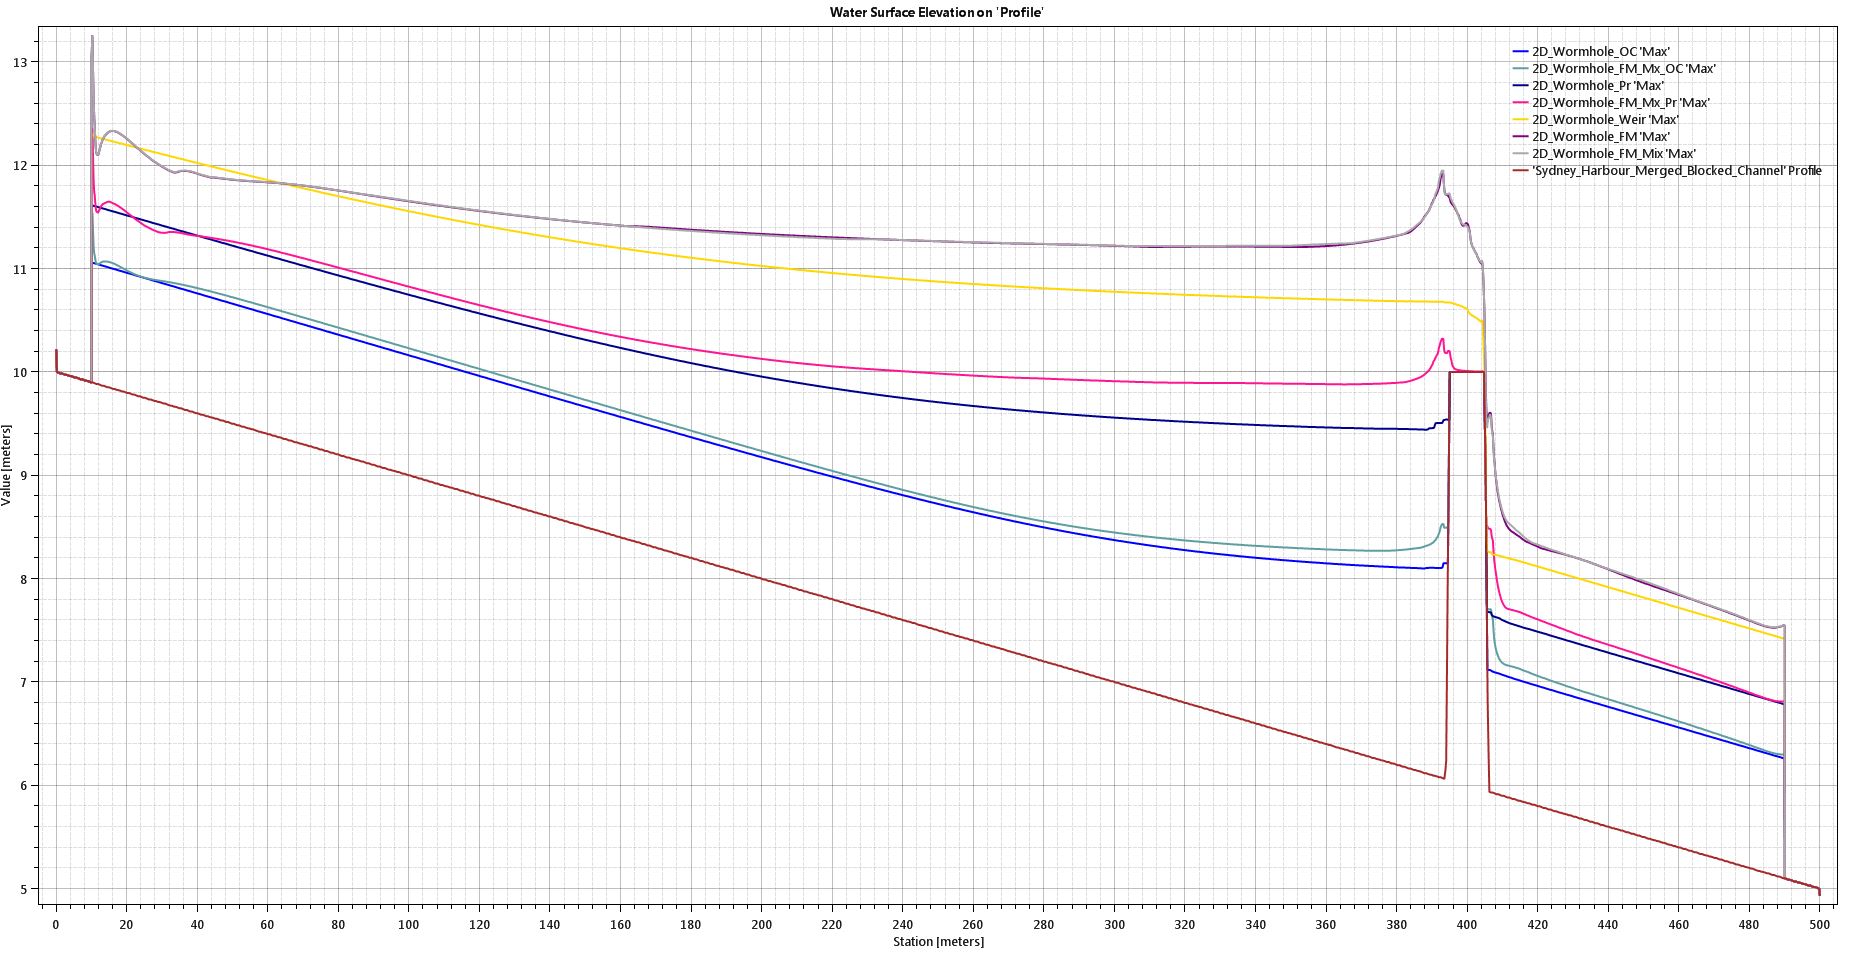
As shown in the figure above, the full momentum approach accounts for some acceleration terms that are ignored in the diffusion wave approach. For our case, this translates into a slight build-up of water immediately upstream of the obstruction. Here are the profiles for the wormhole culverts with Diffusion Wave vs. Full Momentum:
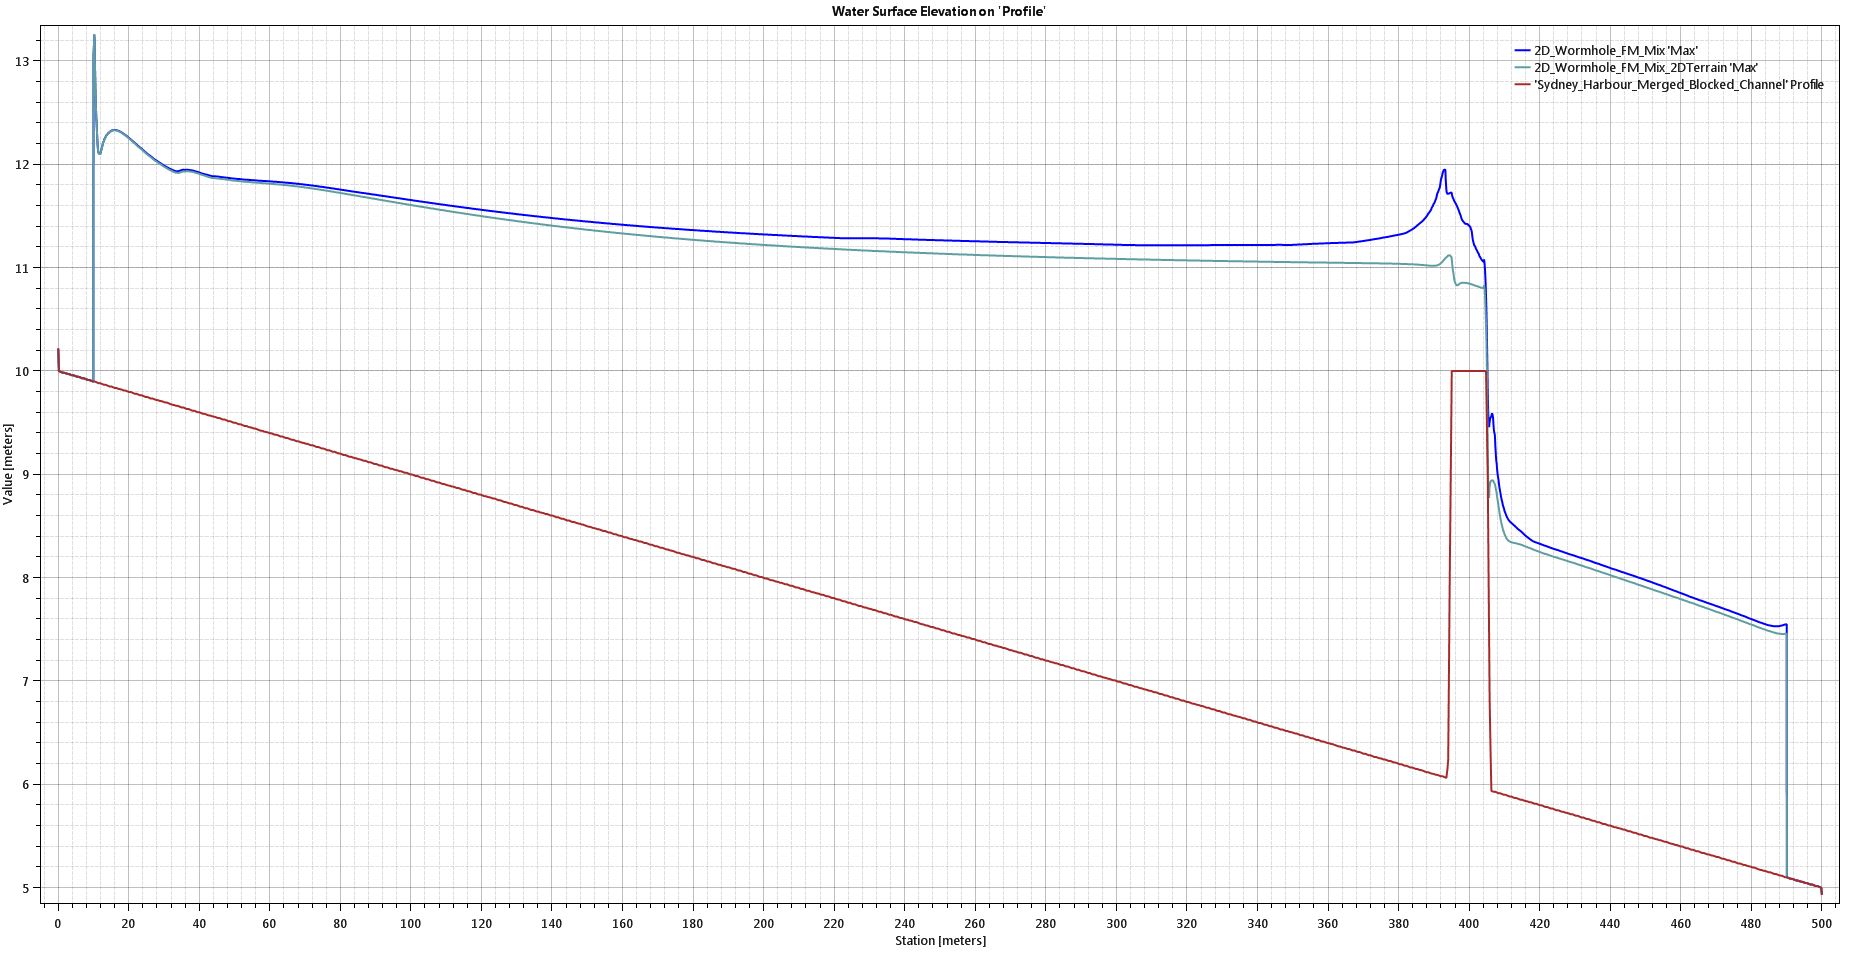
The build-up on the upstream face is much more pronounced for wormhole culverts. Keep in mind that the wormhole method uses an artificially long weir and tries to balance the water surface across the weir length that has been defined in the model. In reality, that weir alignment is simply a line painted on the ground, so it certainly shouldn’t behave like a broad-crested weir. So for the wormhole method, we need to be sure to change the overflow computation method in the connection data editor from “Use Weir Equation” to “Normal 2D Equation Domain”. Here is the comparison between the two methods, with the “terrain” method giving much more realistic results:
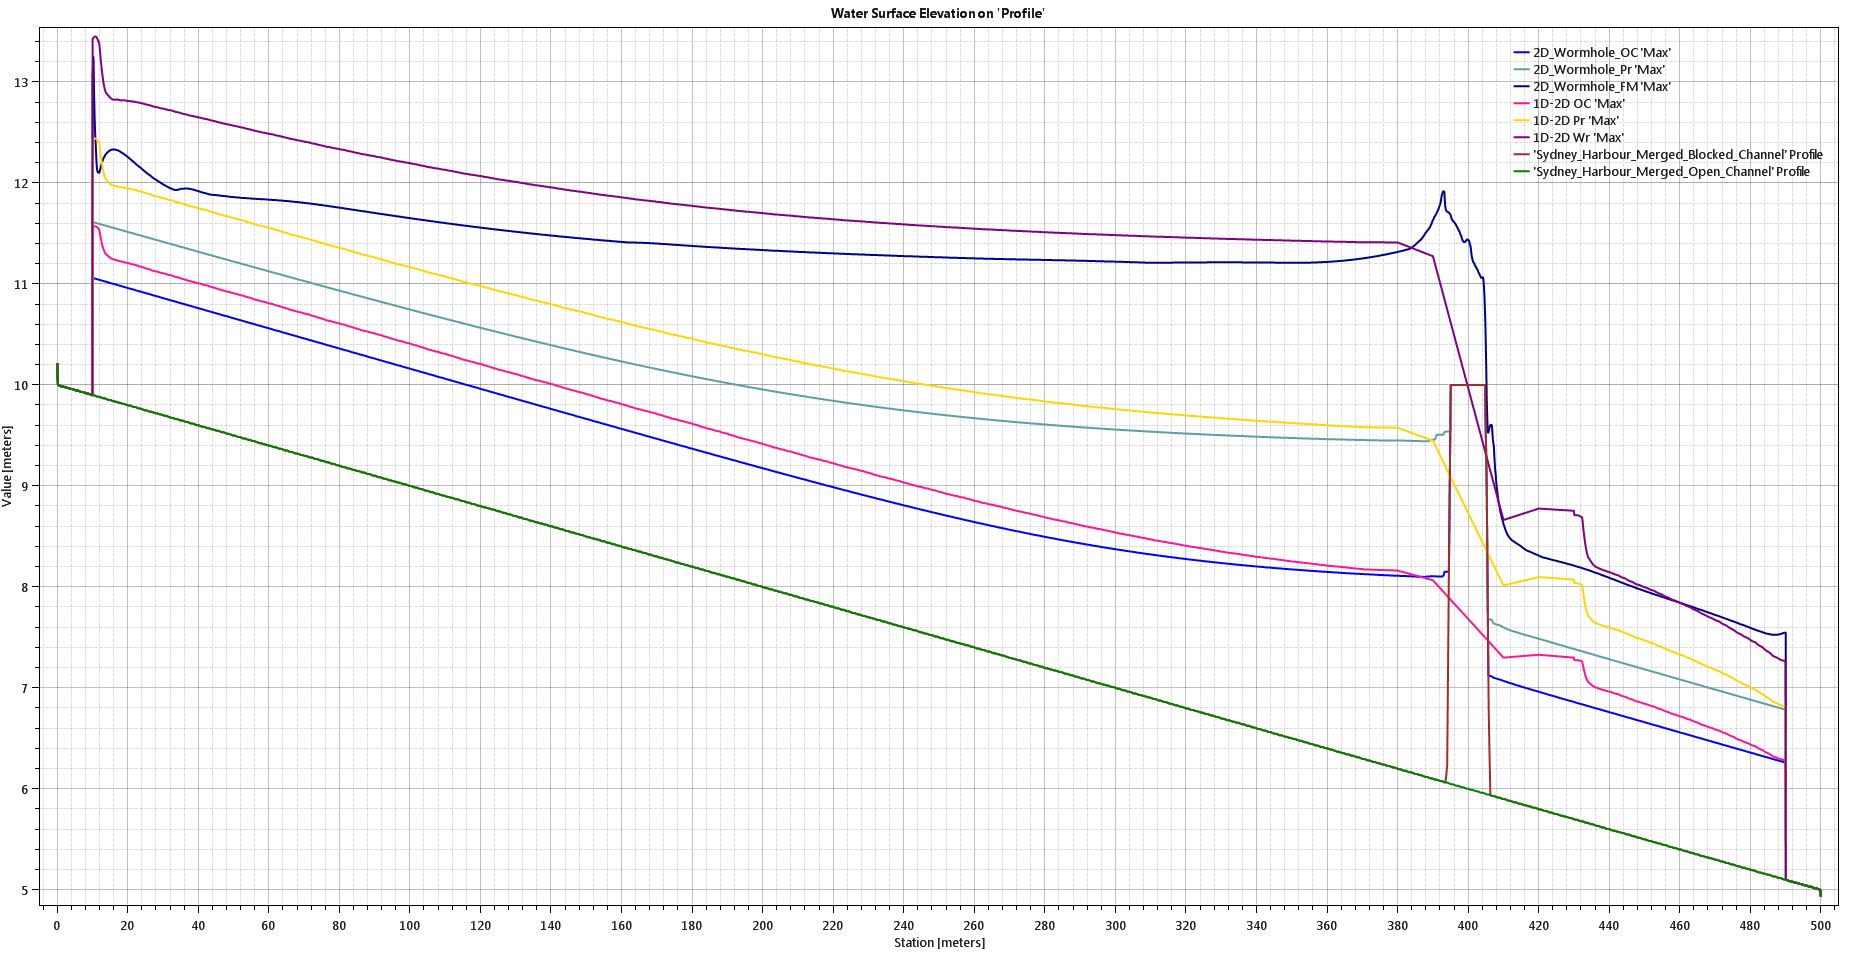
I also set up a coupled 1D-2D model. The downstream interface in particular shows some unrealistic water surface elevations where HEC-RAS tried to balance the 1D and 2D solutions:
This run includes the wormhole culvert with a weir embankment (which needs to be changed to “Normal 2D Equation for more realistic results as discussed above). The imbalances at the 1D-2D interface could probably be cleaned up a bit by adjusting the model parameters, but I’ll leave it as it is for now, just to show that even when issues aren’t immediately discernible in the plan view animations (or in the mass balance errors – in this case below 0.03%) you still can have some screwy results.
Summary
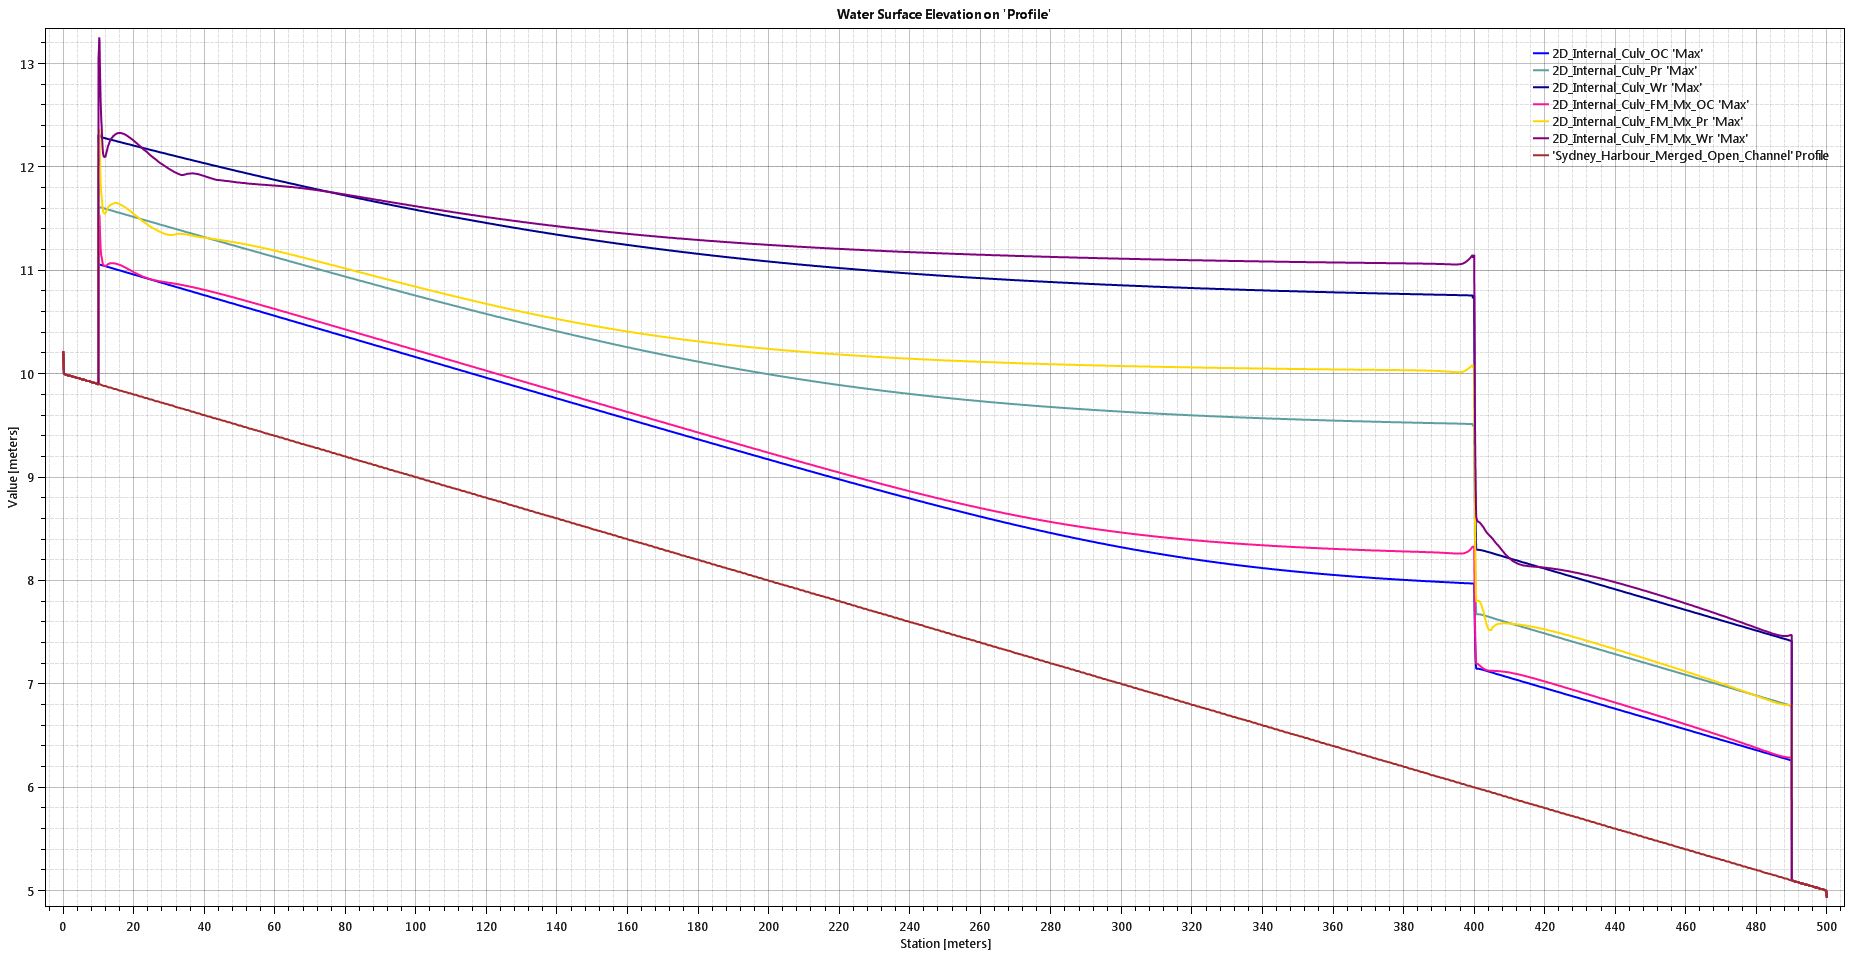
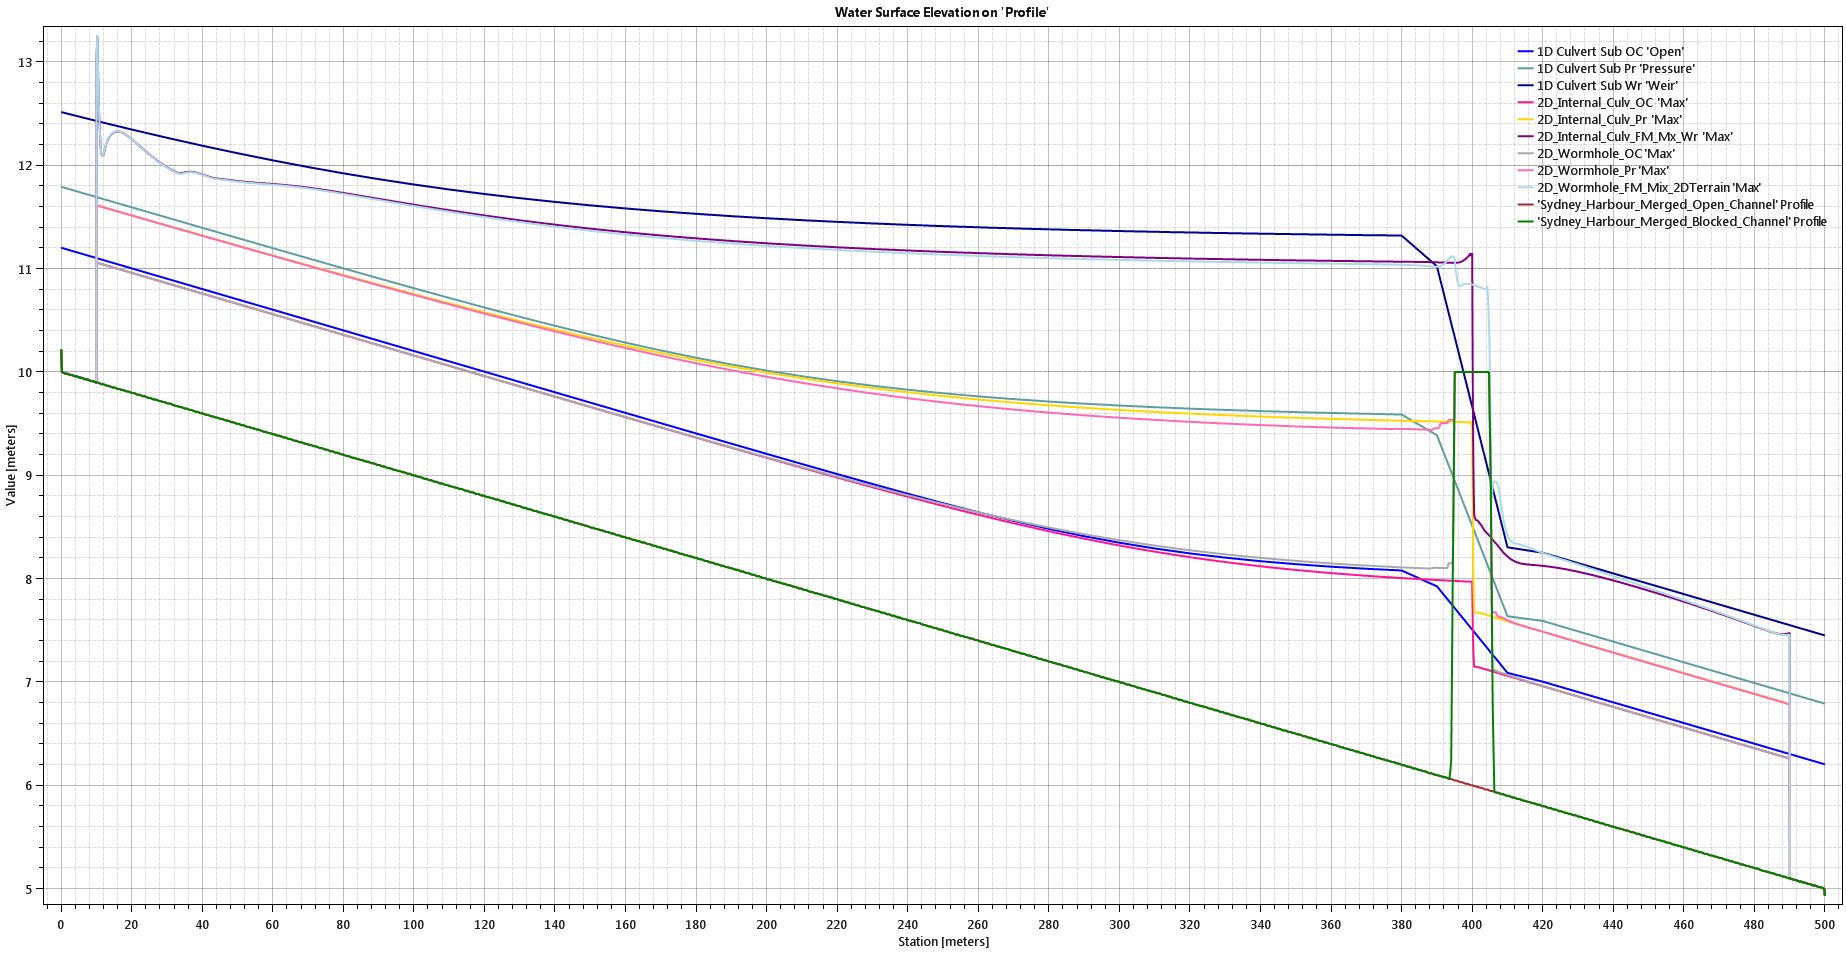
The following figure summarises the differences between 1D culverts, 2D standard culverts, and 2D wormhole culverts:
As you can see, the backwater profiles from the wormhole culverts are very close to those resulting from the standard culverts, and the profiles in the immediate vicinity of the structure are much more realistic.
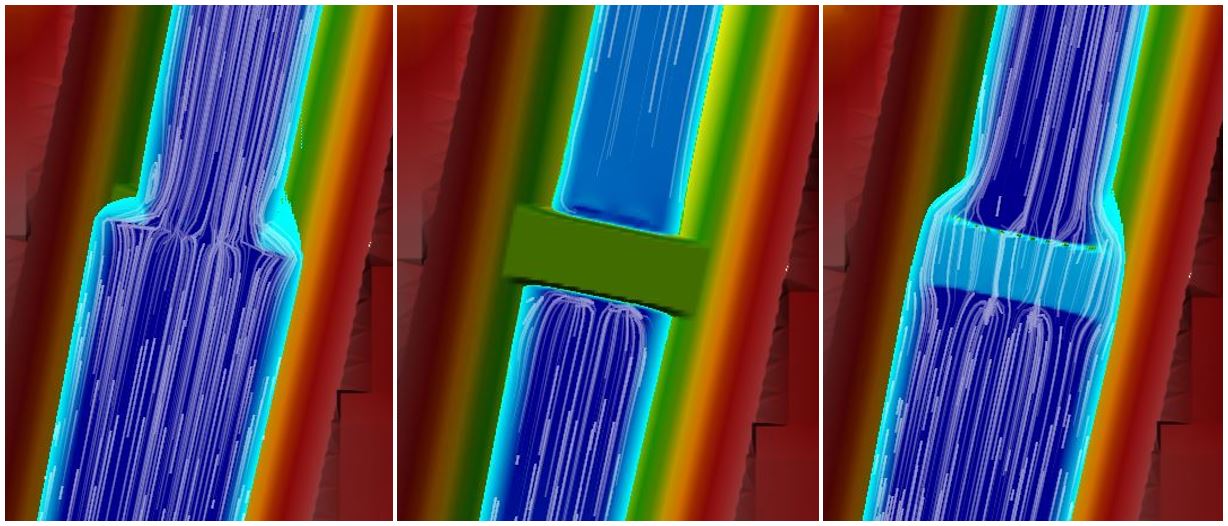
To me, one of the best advantages of the wormhole method is that you get to retain your terrain in your animations, making them much more realistic. The following figures show depth maps with particle tracing turned on. The figure on the left shows weir flow using the standard SA/2D area connection (that requires the deck to be removed from the terrain data and connects cells immediately on either side of the alignment) along with pressure flow (centre figure) and overtopping flow (right figure) for the wormhole method:
[Looking at the inundation extents in the figures above, you can see that the orientation of the grid causes some slight asymmetries in the flow path, even at a very fine grid spacing. If I line the channel up with an exact north-south centreline alignment, the inundation extents end up being symmetrical, and there are some slight differences in the 2D water surface elevation results.]
These sensitivity analyses highlight some of differences between various input parameters and assumptions, many of which have a greater impact on the water surface elevation than the selection of a wormhole culvert vs. a standard culvert. Despite the differences in water surface elevations, the resulting profiles generally stayed within their respective regime (pressure flow did not change to open channel flow or weir flow, for example).
“Tear Down the Wall!”
In short, it looks to me like wormhole culverts have passed the test! Luckily, the need for wormhole culverts has now disappeared with the release of 5.0.4, but I’ll keep these results posted since they show some of the sensitivities to different approaches to culvert hydraulics.
Read more:
- Wormhole Culverts Part 1: Introducing the wormhole concept
- Wormhole Culverts Part 2: Using wormhole culverts for internal boundary conditions
- Wormhole Culverts Part 3: Comparing wormhole culverts to 1D/2D bridges and culverts
- Wormhole Culverts Part 4: Sensitivity analyses for wormhole culverts
- Wormhole Culverts Part 5: What’s the best shape for a wormhole culvert?
Contact and feedback:
- Please e-mail me any comments or questions about wormhole culverts or other topics
- Contribute to the discussion about wormhole culverts on the RAS Solution blog
- Subscribe to receive updates when new content is published
- Join the newly created LinkedIn groups for dam break modelling and sediment transport modeling
Krey Price
Surface Water Solutions


