Using a Frequency Storm with Rain-on-grid hydraulics
[Download the Excel spreadsheet: Surface Water Solutions Frequency Storm Calculator V1.0]
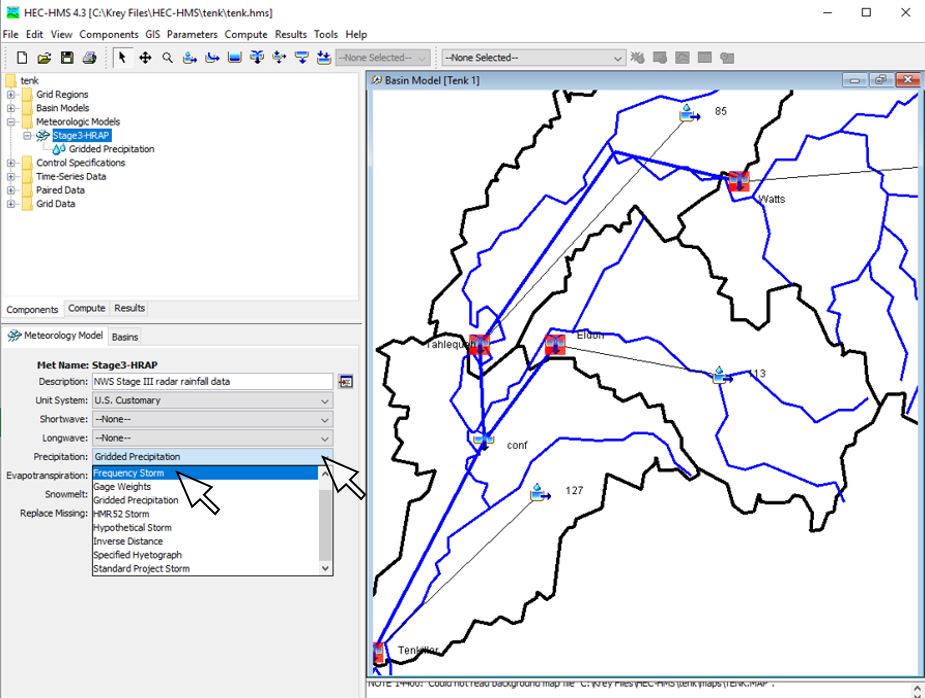
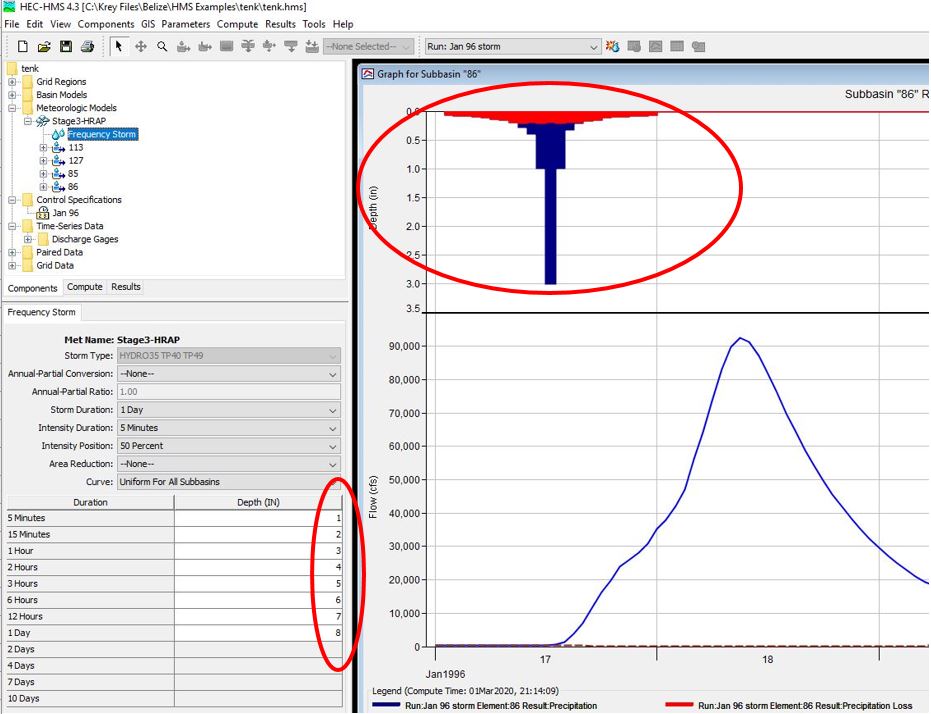
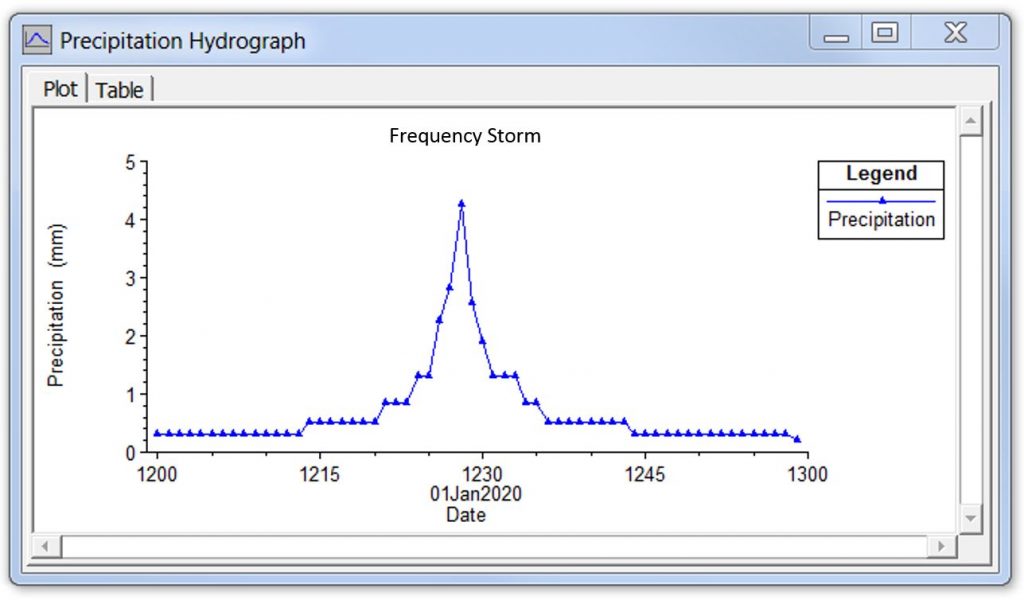
If you have used HEC-HMS to develop rainfall-runoff relationships for your catchment/watershed, you may be familiar with the option of selecting the “frequency storm” as the precipitation input for your meteorological model. The frequency storm asks for rainfall depths corresponding to a range of durations:
The screen shots above show a hypothetical set of rainfall depths that I have applied to the Tenk model (example file that ships with the software) as a centrally-loaded frequency storm.
So what is the frequency storm all about?
Essentially the frequency storm builds the intensity associated with every duration into a single, hypothetical storm event.
Chapter 4 of the NRCS National Engineering Handbook (Part 630) outlines Storm Rainfall Depth and Distribution techniques, including the NRCS synthetic design storm, which is an example of a frequency storm:
“An important characteristic of NRCS synthetic rainfall distributions is that the maximum rainfalls for all durations from 5 minutes to 24 hours are represented accurately. The primary assumption made in the development of the rainfall distribution is that the rainfall values for all durations for a single return period occur within one 24-hour period. For example, the 25-year 5-minute, 25-year 10-minute, 25-year 15-minute, and up the 25-year 24-hour rainfall occurs within the same design storm and are centrally nested within each greater storm duration listed.” (Page 4.27)
Some rainfall patterns are based on actual, observed events, with patterns that you might expect to see and capture with gauge data; the frequency storm, however, is purely hypothetical and its occurrence would be very improbably to say the least. What are the chances that a 7-day, 100-year storm event would also include the 100-year 1-minute intensity, the 100-year 1-hour intensity, and the 100-year 24-hour intensity, all in the same event? I would venture to say that it has never happened in the entire history of this planet! That said, the frequency storm can be a very useful bookend, particularly for a rain-on-grid hydraulic analysis.
What if, for example, you wanted to include a carpark culvert with a 2-minute catchment response time in addition to a proposed detention basin with a 1-hour response time – and perhaps also a larger river basin with a 24-hour response time – all in the same model? The frequency storm would max them all out. A hydrological analysis is generally based on a set of conditions that represents the critical event at a single node; a typical rainfall-runoff model that uses a more realistic, critical storm pattern would need to be run separately for each of these different scales.
In light of recent advances in both hardware and software, there is an increasing trend toward more comprehensive analyses. The 2016 update to Australian Rainfall and Runoff (ARR) guidelines, for example, recommends the use of ensemble modelling and Monte Carlo analyses for hydrology. Despite the technical advances, that approach is sometimes not practical for hydraulic models due to modelling time requirements. Applying multiple patterns might be feasible for hydrological models that can run thousands of scenarios in a single shot, but what do you do when your hydraulic model takes a week to run a single storm pattern?
The frequency storm is an inherently conservative approach; in essence, a 100-year frequency storm has a much less frequent recurrence interval than 100 years if you were to assess it in terms of the overall damage or flood risk within a catchment. Because the frequency storm includes the entire range of critical durations in a single simulation, it can provide more comprehensive – albeit conservative – results that highlight individual areas of concern and can give you a good idea of where to focus your efforts.
Frequency Storm Generator
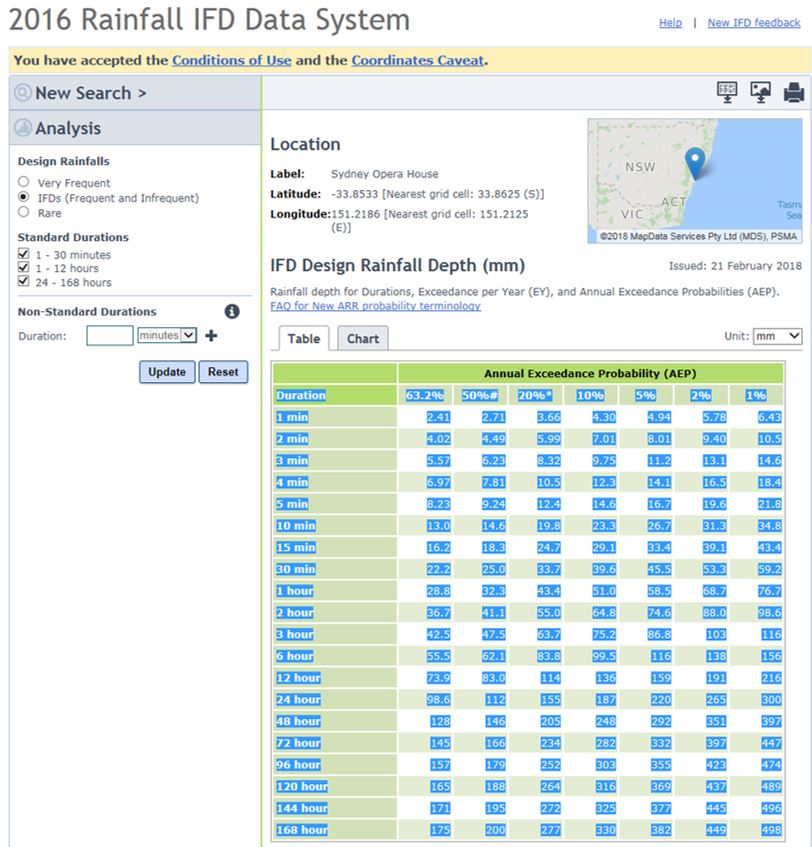
Generating a frequency storm requires Intensity-Frequency-Duration (IFD) data. In some areas, this data may require substantial estimation due to a lack of historical gauge data, whereas other areas have readily available, publicly accessible data sources based on an extensive gauging network and stochastic analyses. The Australian Bureau of Meteorology, for example, compiles gauge-based IFD data that can be downloaded for any geographic location within Australia.
To mimic what HMS does automatically using Australian rainfall data, I have developed a spreadsheet that takes IFD data straight from the BoM interface and converts it into a nested frequency storm that can be entered as a rain-on-grid hydrological boundary condition in HEC-RAS or other hydraulic models.
[If you would like a copy of the spreadsheet, here is a download link. Please contact me via e-mail with any questions or suggestions for improvement for the spreadsheet, such as incorporating pre-burst or climate change.]
Here are some screen shots along with the procedure for generating a frequency storm using the “Surface Water Solutions Frequency Storm Calculator.xlsx” spreadsheet:
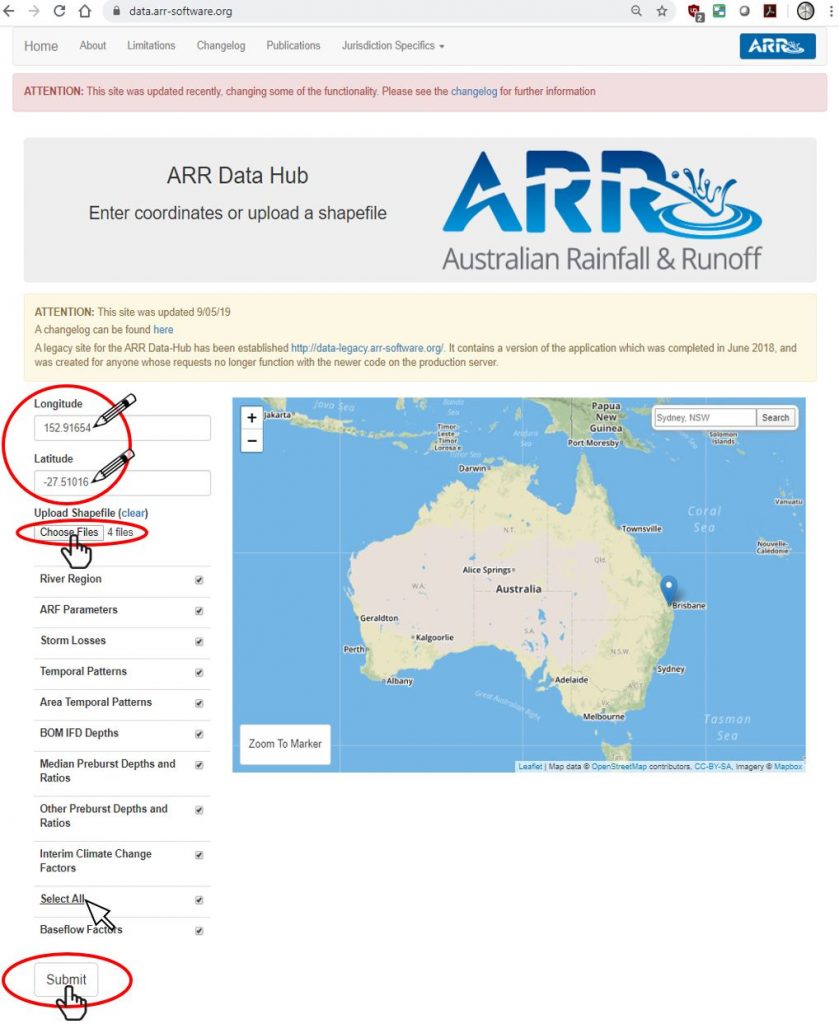
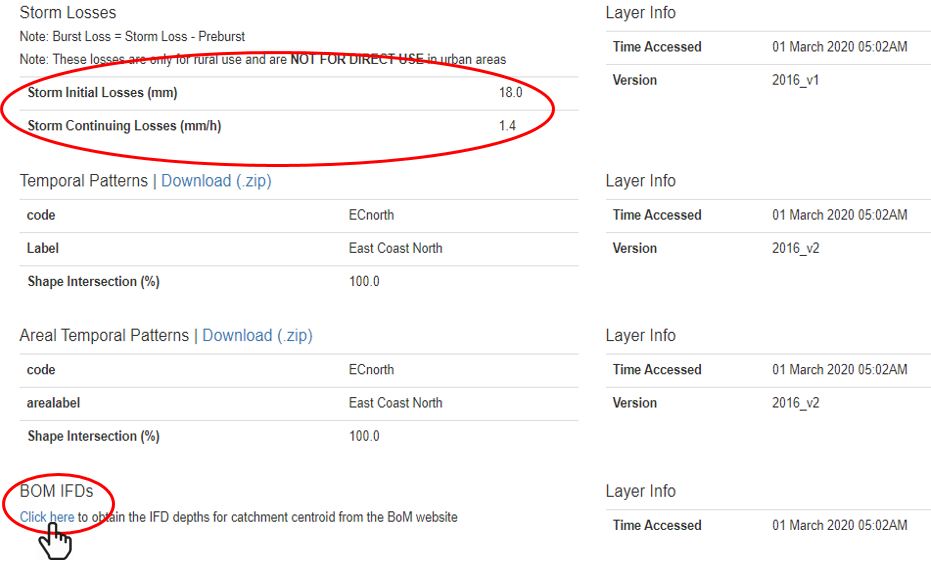
Step 1. Enter the coordinates of your point of interest or upload a shape file of the catchment boundaries to the ARR data hub here. Note the preburst, initial loss and continuing loss values under “Storm Losses” heading.
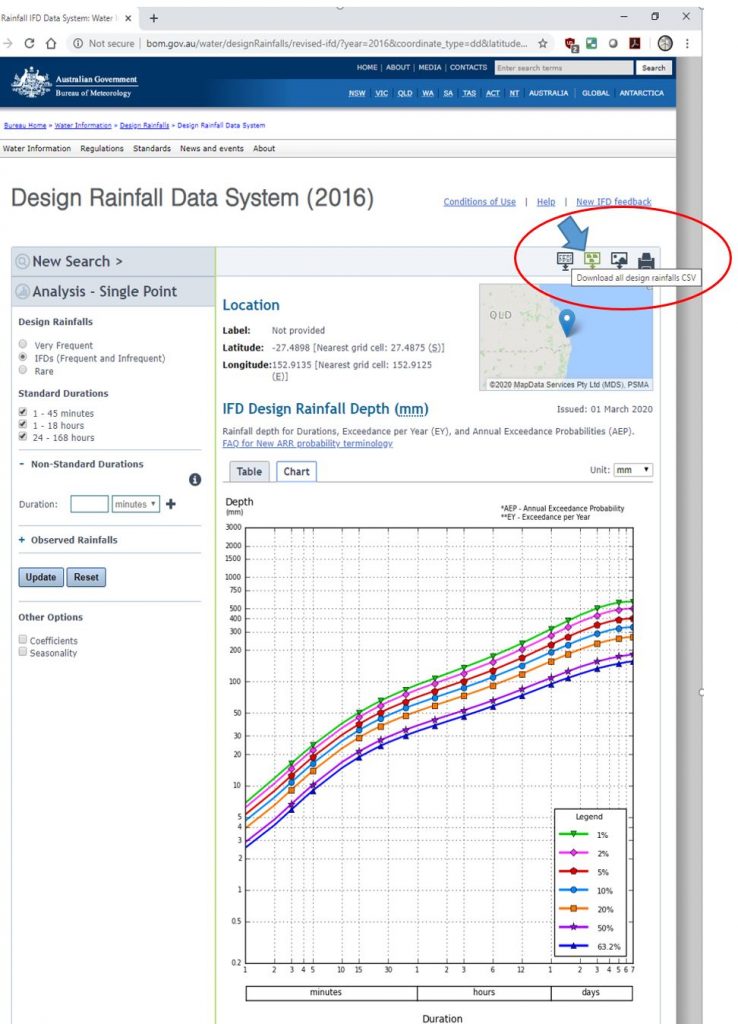
Step 2. Select “BoM IFDs” which will take you straight to the BoM IFD system for the selected coordinates (best to check a few points within your catchment to get a feel for the overall variation across the catchment).
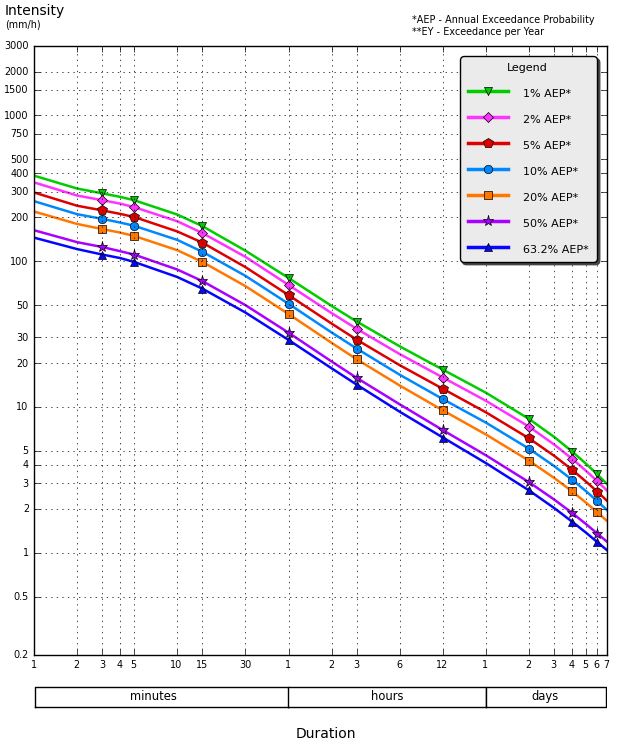
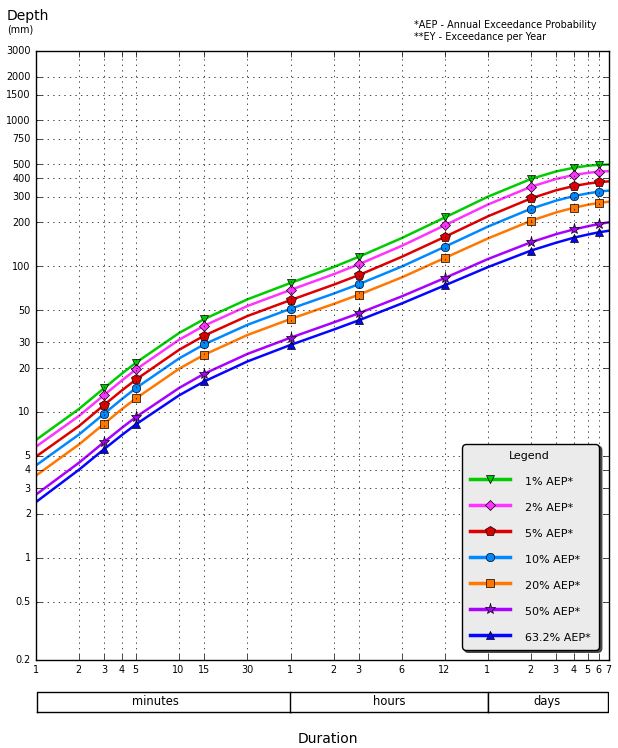
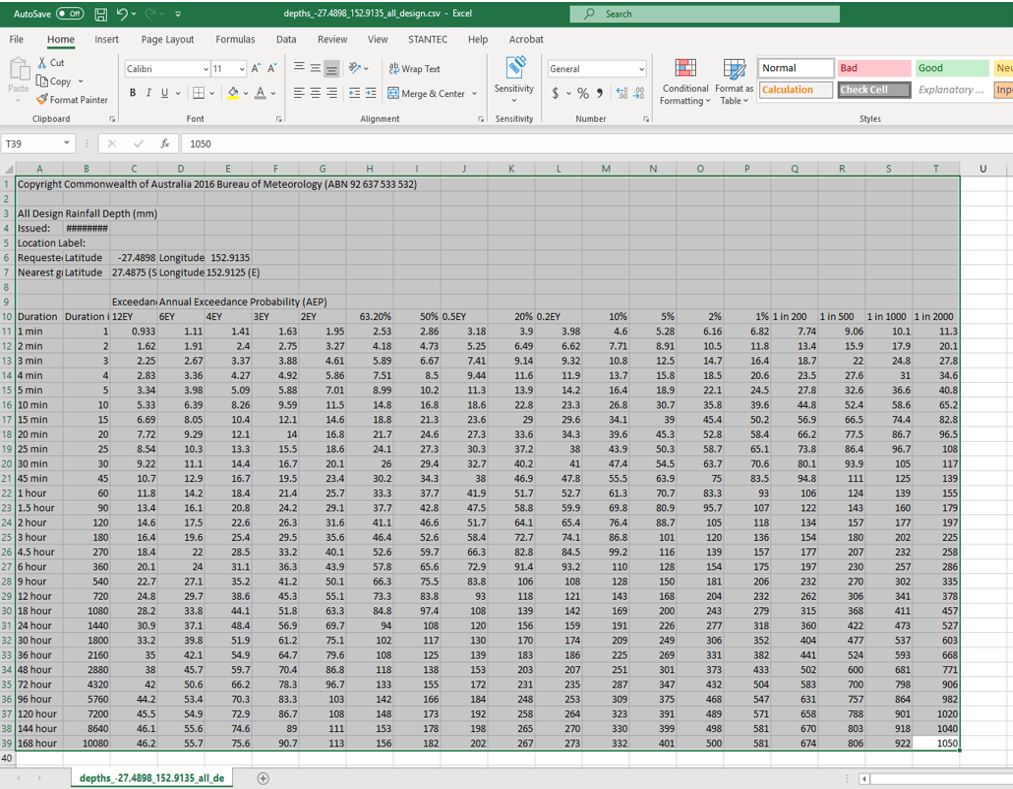
The program should generate localised IFD curves that can be displayed in tabular format (select “Table” tab) or as graphical charts (select “Chart” tab). Tables and charts can be displayed in terms of intensity or depth, as shown below:
Step 3. Select “Download All Design Rainfalls csv”
Step 4. Open the downloaded csv file, copy all contents, and paste to the spreadsheet tab entitled “Paste from BoM IFD”
Step 5. Enter loss rates:
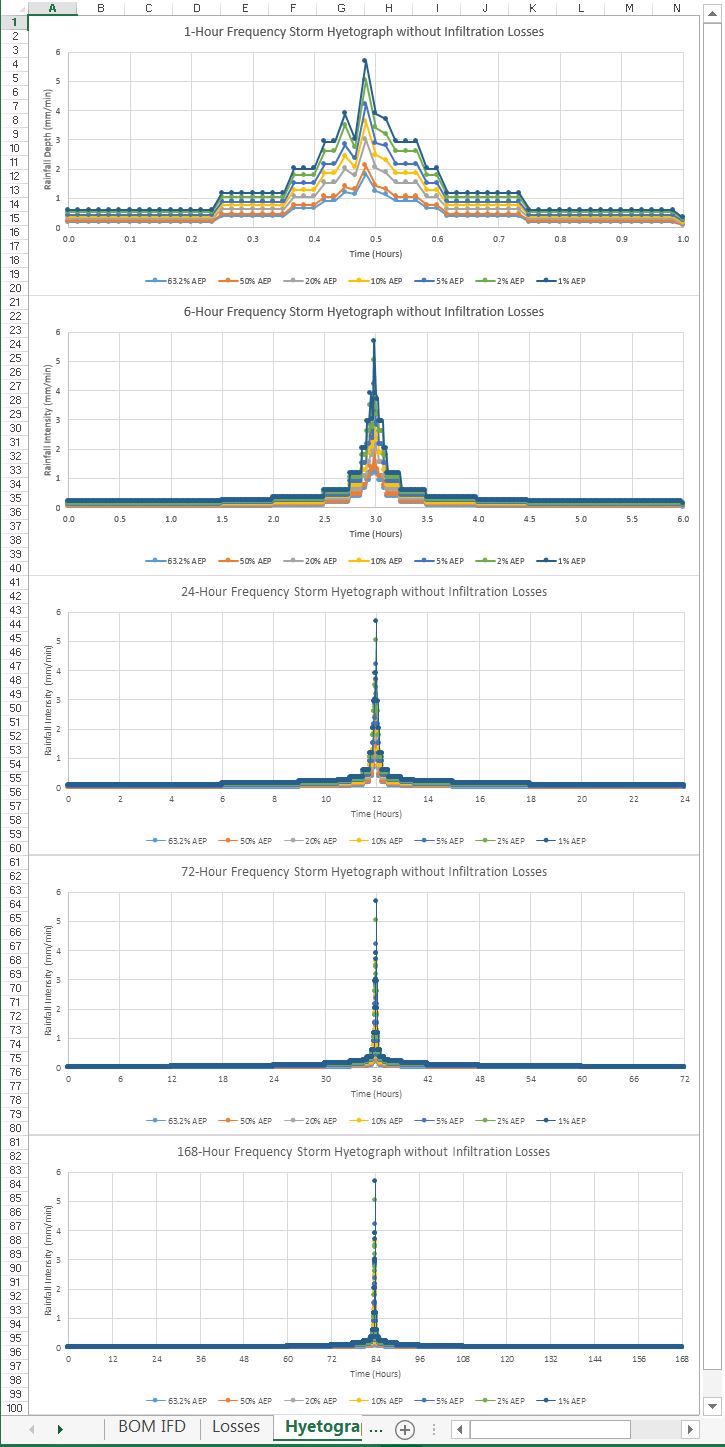
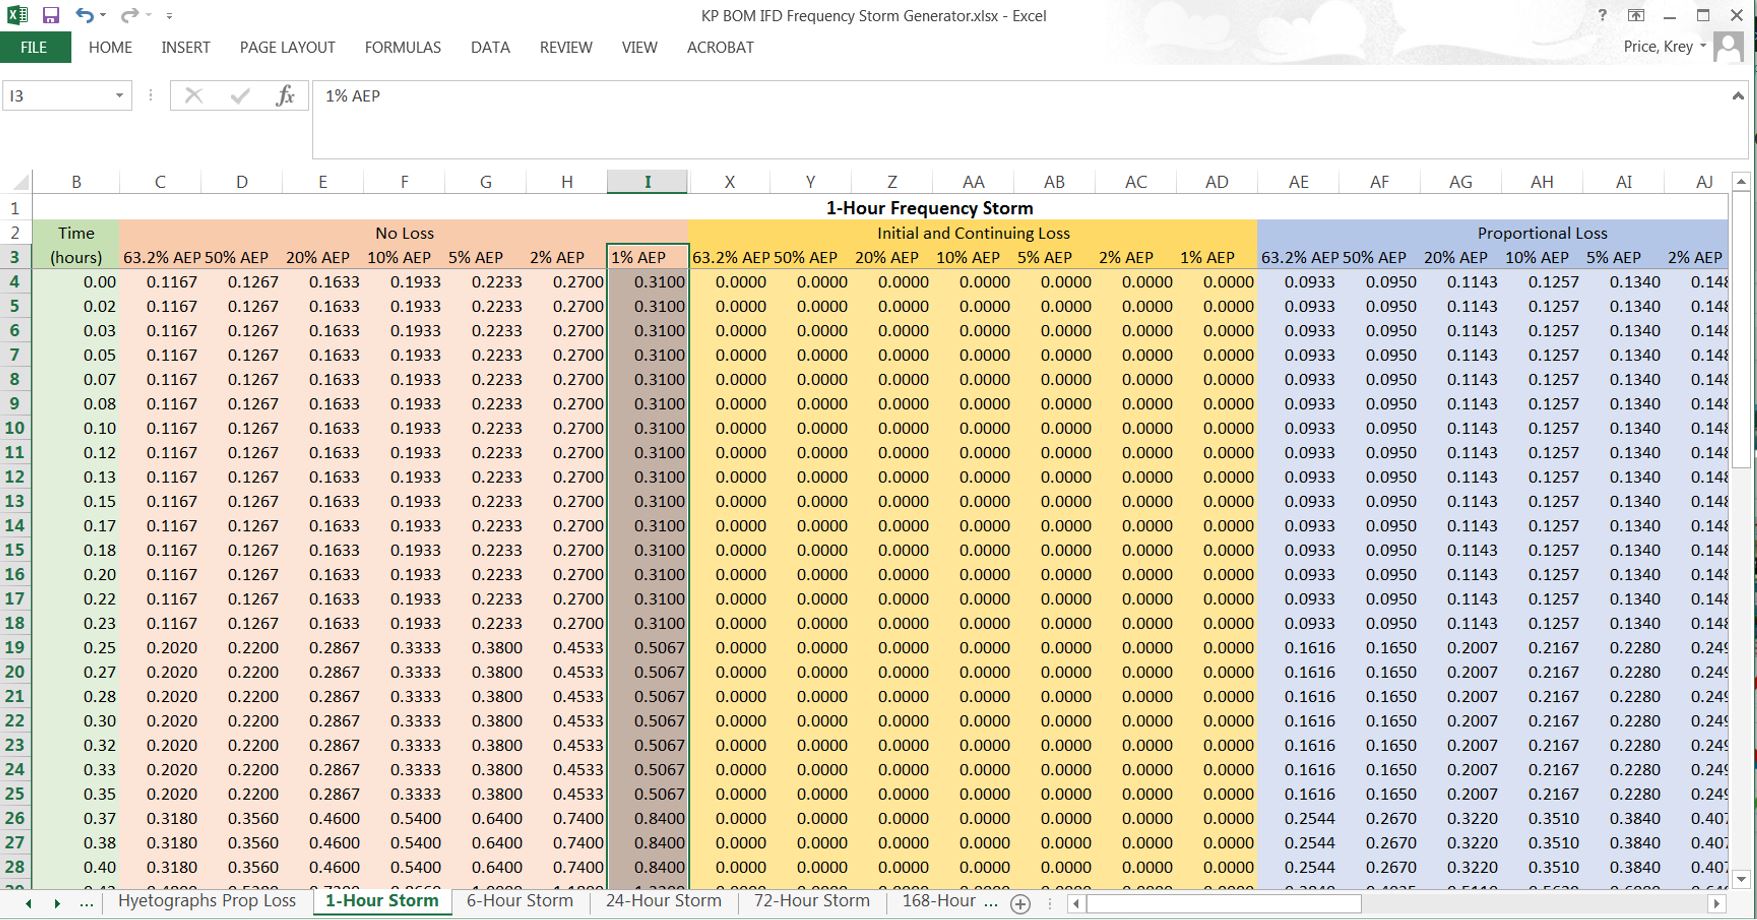
The spreadsheet automatically generates tabular and graphical results for frequency storms with durations of 1 hour, 6 hours, 24 hours, and 72 hours. Values are generated for front-loaded, middle-loaded, or back-loaded storms with or without infiltration losses (Subtract any preburst you wish to apply or use zero values for all loss rates to represent saturated/impervious conditions).
[The drop just before the peak is a glitch in the BoM script; I have left it in the spreadsheet to remain functional when the glitch is corrected.]
Step 6. Copy the appropriate column from the spreadsheet and paste into hydraulic model using 1-minute time step. :
Using frequency storm data with HEC-HMS and HEC-RAS
Hopefully we can look forward to a day when HEC-HMS and HEC-RAS are combined into a single model, but in the meantime, HEC users typically apply HEC-HMS for hydrology and HEC-RAS for hydraulics.
The dividing line between hydrological models that quantify rainfall-runoff and hydraulic models that characterise the runoff keeps getting blurrier with the increased use of rain-on-grid or direct precipitation boundary conditions in hydraulic models.
[As the H&H trivia bit for the day, does the “H” in HEC stand for hydrological or hydraulic? Click here for the answer!]
Those using HEC-RAS for rainfall-runoff hydrology will be limited by the current inability to incorporate spatially varying infiltration (or any infiltration for that matter). Spatially varying rainfall is another limitation. Temporally varying rainfall patterns can be entered as precipitation time series, but each 2D Flow Area can currently only handle a single pattern across all cells; spatially varying rainfall and infiltration are both reportedly in the works for Version 5.1, but that release is not expected until late 2020 at the earliest.
Another limitation that affects direct rainfall models in HEC-RAS is the lack of depth-varying roughness capabilities. When a single model is intended to simulate large sheet flow areas in addition to concentrated flow paths with deep, channelised flow, depth-varying roughness can have a significant effect on the results, and sensitivity analyses should be performed over a range of roughness coefficients. See a demonstration of our hack for introducing depth-varying roughness into HEC-RAS models here.
With those disclaimers out of the way, HEC-RAS can still be a very useful tool for direct rainfall models, as long as infiltration is removed up front so that the precipitation time series includes rainfall excess only. A HEC-RAS rain-on-grid model generally should not serve as a substitute for detailed hydrological analyses, but if you have terrain data covering your entire catchment, it can help confirm show flow paths, characterise basin response times, and provide other useful information to highlight areas requiring further adjustment or calibration in the hydrological model.
Here is a basic model setup in HEC-RAS covering rain-on-grid:
Extracting results is covered here in the next video in the series:
We discuss some parameter selection and modelling considerations in our recent webinar covering rain-on-grid modelling in HEC-RAS:
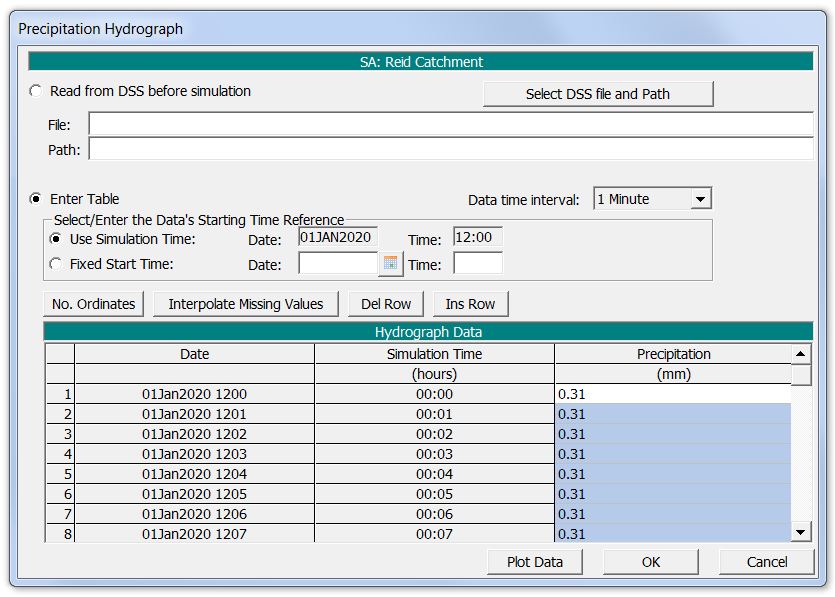
Assuming you already have a HEC-RAS model with a 2D flow area covering your catchment extents, the values copied from the frequency storm generator spreadsheet can be pasted into precipitation time series (and always remember to plot data just to make sure there aren’t any typos):
The first value (at time step 00:00) is actually ignored in the model, so technically, we should paste our column starting with Row 2.
It may be worth comparing front-loaded, middle-loaded, and back-loaded events to assess the sensitivity. The spreadsheet places the bursts at 0%, 50%, and 100% of the time. These are not necessarily realistic (rainfall ceases immediately following the burst in the back-loaded events, for example), but the sensitivities will show the maximum impact of the loading on the effect of the initial loss rate in particular. A discussion of ARR techniques, which use 40% and 60% as thresholds, is included here. Additional details are included in ARR Book 2 Chapter 5: Temporal Patterns. Keep in mind that HEC-HMS only allows the main burst to be loaded between 25% and 75% of the time.
Once you run the plan and open the results in RAS Mapper, you may wish to play around with the Render Mode settings (Tools | Options) to adjust the display thresholds and draping methods. These options can have a very substantial effect on the appearance of the results; keep in mind, however, that this has nothing to do with the computations, it only shows you the previously computed results in a different way.
Also keep in mind that this is not a substitute for detailed hydrological analyses as described in ARR 2016, but rather a bookend to show you upper limits and to find the features that need further assessment. The spreadsheet includes the ability to enter loss rates, but if it holds up to a frequency storm without losses or areal reduction, you can be reasonably confident that it will handle any temporal storm pattern that ARR will throw at you.
While the spreadsheet is set up to align with the BoM IFD format, it can be used in conjunction with any IFD data. If only a few ordinates are known, these can be entered in the appropriate row, then the remaining values could be interpolated. (Hint: try the “interpolate values” button in the HEC-RAS unsteady flow editor).
It is generally worth checking rain-on-grid results against rainfall-runoff predictions. In Australia, you may wish to check the resulting peak flows against the online RFFE tool. As always for rain-on-grid models, watch out for artificial storage in your system caused by bad terrain data! Roughness and other factors might be used to align peak flows generated in HEC-RAS more closely with the rainfall-runoff results, but the physical processes are quite different. Roughness and terrain storage, for example, may reduce and attenuate peak flows at the outlet similar to the effect of interflow or vegetation in the actual watershed.
Remember, calibration is key!
Please pass along any comments or suggestions.
Krey Price
Surface Water Solutions

